Last updated: 2026-07-26
The most reliable used car in 2026 is the 2022 Lexus RX with a reliability score of 90/100, based on 0 recalls and 35 owner complaints filed with NHTSA. Rankings are updated as new data becomes available from federal safety databases and cover 207 vehicles across sedans, SUVs, trucks, and minivans.
Most Reliable Used Cars — Ranked by Data
Every model is scored on four signals — complaint severity, repair costs, recall impact, and issue diversity — and normalized by sales volume so popular nameplates aren't unfairly penalized. The inputs come from NHTSA recall records, owner-filed complaints, and independent repair-cost databases. The 2022 Lexus RX leads the pack with a score of 90/100.
These rankings are fully algorithmic — no paid placements, no reputation adjustments. Drill into any model to see the recall count, complaint breakdown, and sub-scores behind its rating. Full methodology lives on our data sources page.
Top 10 Most Reliable Used Cars

Editor's Analysis
What the data tells us: the gap between a top-ranked car and the middle of the pack is usually narrower than buyers expect — often a few complaints per thousand vehicles sold separate an 85 from a 75. Below 50, though, the story changes: those scores consistently track with higher repair frequency and more severe issues, especially in powertrain and safety-critical components.
Brand vs. model matters: a few manufacturers show up repeatedly in the top 10, but reliability still varies model-to-model and year-to-year within the same brand. A top-ranked sedan can share a parent company with a poorly-ranked SUV. Check the specific model and year, not just the badge.
What to look for beyond the score: The reliability score is a starting point, not the full picture. Before buying, check the years-to-avoid page for your chosen model to identify specific model years with known issues. Look at complaint categories (not just totals) to understand whether problems are cosmetic or safety-related.
Found Your Next Car? Check Its History
Before you buy, a VIN check reveals hidden accidents, title problems, and open recalls that reliability scores can't show you.
- Accidents
- Open Recalls
- Title History
- Odometer Rollback
Complete Reliability Rankings
| # | Vehicle | Best Year | Score | Rating | Recalls | Complaints / 10k | Maint. Rating | Est. Repair Cost |
|---|---|---|---|---|---|---|---|---|
| 1 | Lexus RX | 2022 | 90/100 | Excellent | 0 | 3.7 | 5 | |
| 2 | Lexus ES | 2021 | 88/100 | Excellent | 0 | — | 4 | |
| 3 | KIA Sedona | 2021 | 88/100 | Excellent | 0 | — | 4 | |
| 4 | Mazda CX-5 | 2022 | 87/100 | Excellent | 0 | 3.3 | 4.5 | |
| 5 | Honda HR-V | 2021 | 86/100 | Excellent | 3 | 3.8 | 5 | |
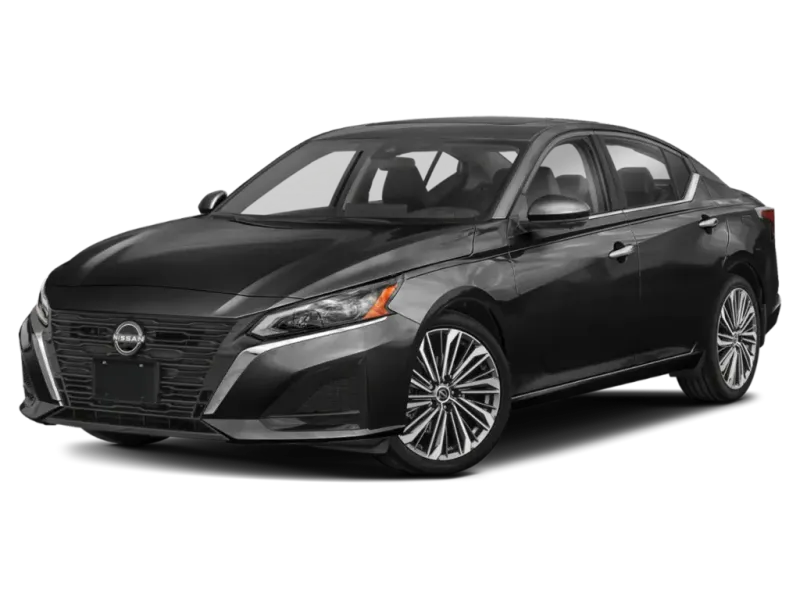
| 6 | Nissan Altima | 2023 | 84/100 | Excellent | 0 | 1.9 | 4 | |
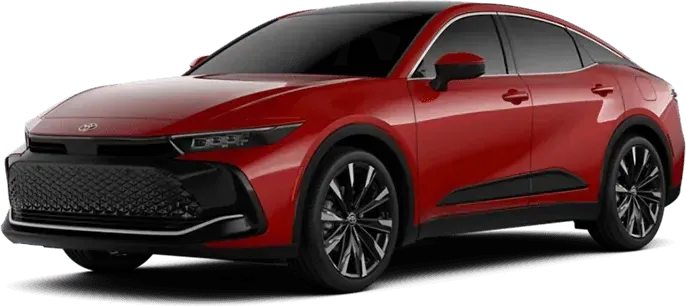
| 7 | Toyota Crown | 2023 | 84/100 | Excellent | 0 | 0.0 | 4 | |
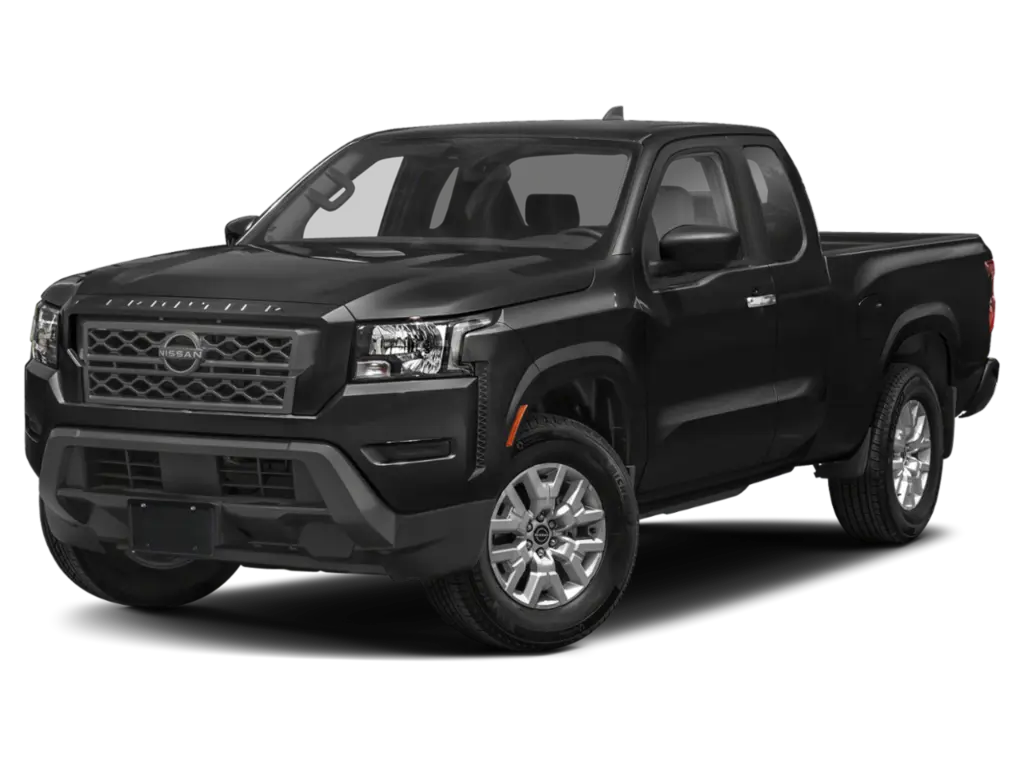
| 8 | Nissan Frontier | 2021 | 84/100 | Excellent | 0 | 0.0 | 4 | |
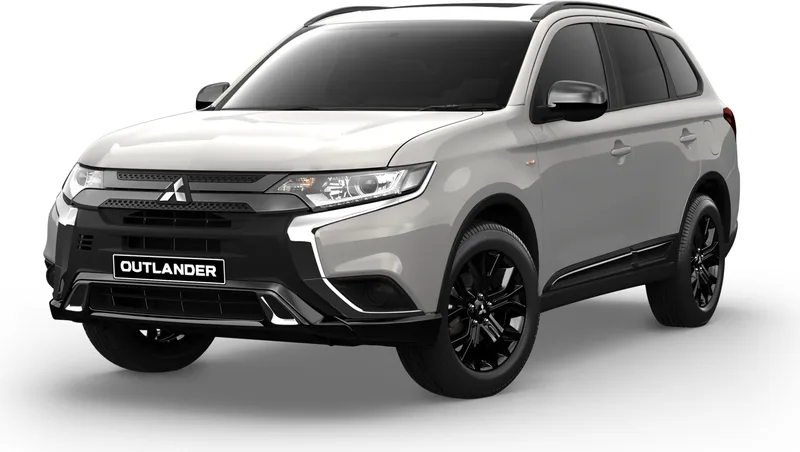
| 9 | Mitsubishi Outlander | 2021 | 84/100 | Excellent | 0 | 0.0 | 4 | |
| 10 | Lexus UX | 2020 | 84/100 | Excellent | 0 | 0.0 | 4 |
Reliability Score Comparison
Visual comparison of reliability scores across all vehicles in our database. Longer bars indicate higher reliability.
Rankings by Category
Most Reliable Used Sedans
See all 61→Most Reliable Used SUVs
See all 117→Most Reliable Used Trucks
See all 17→Most Reliable Used Minivans
See all 6→Most Reliable Used Coupes
See all 6→Rankings by Powertrain
Shopping by powertrain rather than body style? Electric vehicles have a different reliability profile from gas cars — no engine, no transmission, but battery software and charging hardware introduce their own failure modes.
Best Budget Used Cars by Price
The highest-scoring used cars in each price bracket. Estimates reflect current dealer listings.
Best Budget Cars Under $15,000
| # | Vehicle | Best Year | Score | Rating | Recalls | Complaints / 10k | Maint. Rating | Est. Repair Cost |
|---|---|---|---|---|---|---|---|---|
| 1 | Chevrolet Trax | 2021 | 81/100 | Excellent | 0 | 4.2 | 4 | |
| 2 | Toyota Corolla | 2018 | 80/100 | Excellent | 3 | 4.5 | 4.5 | |
| 3 | Nissan Rogue | 2020 | 79/100 | Good | 2 | 8.1 | 4 | |
| 4 | Nissan Pathfinder | 2020 | 78/100 | Good | 0 | 8.9 | 3.5 | |
| 5 | Hyundai Elantra | 2019 | 78/100 | Good | 1 | 11.1 | 4.5 | |
| 6 | Nissan Sentra | 2018 | 77/100 | Good | 2 | 8.5 | 4 | |
| 7 | Nissan Altima | 2018 | 76/100 | Good | 2 | 10.4 | 4 | |
| 8 | Chevrolet Malibu | 2021 | 74/100 | Good | 2 | 15.5 | 4 | |
| 9 | KIA Sportage | 2019 | 74/100 | Good | 2 | 7.1 | 4 | |
| 10 | Hyundai Sonata | 2019 | 71/100 | Good | 0 | 16.5 | 3 |
Best Budget Cars Under $20,000
| # | Vehicle | Best Year | Score | Rating | Recalls | Complaints / 10k | Maint. Rating | Est. Repair Cost |
|---|---|---|---|---|---|---|---|---|
| 1 | Honda HR-V | 2021 | 86/100 | Excellent | 3 | 3.8 | 5 | |
| 2 | Honda Civic | 2021 | 81/100 | Excellent | 3 | 4.5 | 4.5 | |
| 3 | Honda CR-V | 2021 | 77/100 | Good | 3 | 6.7 | 4.5 | |
| 4 | Toyota RAV4 | 2018 | 76/100 | Good | 3 | 7.7 | 4 | |
| 5 | Chevrolet Blazer | 2021 | 74/100 | Good | 1 | 14.8 | 4 | |
| 6 | Honda Accord | 2020 | 73/100 | Good | 8 | 17.2 | 4.5 | |
| 7 | Subaru Crosstrek | 2020 | 72/100 | Good | 1 | 76.3 | 4.5 | |
| 8 | Jeep Grand Cherokee | 2020 | 72/100 | Good | 3 | 9.9 | 3.5 | |
| 9 | Subaru Forester | 2020 | 71/100 | Good | 0 | 33.0 | 3.5 | |
| 10 | KIA K5 | 2021 | 71/100 | Good | 6 | 14.3 | 4 |
Best Budget Cars Under $25,000
| # | Vehicle | Best Year | Score | Rating | Recalls | Complaints / 10k | Maint. Rating | Est. Repair Cost |
|---|---|---|---|---|---|---|---|---|
| 1 | Chevrolet Colorado | 2020 | 81/100 | Excellent | 0 | 7.4 | 4 | |
| 2 | Toyota Corolla Cross | 2022 | 80/100 | Excellent | 2 | 6.5 | 4.5 | |
| 3 | Toyota Venza | 2021 | 79/100 | Good | 1 | 1.1 | 4 | |
| 4 | Ford Ranger | 2022 | 75/100 | Good | 5 | 6.0 | 4 | |
| 5 | Chevrolet Tahoe | 2018 | 72/100 | Good | 3 | 8.4 | 3.5 | |
| 6 | Toyota Highlander | 2018 | 72/100 | Good | 5 | 9.9 | 4 | |
| 7 | Toyota Sienna | 2019 | 71/100 | Good | 7 | 5.6 | 3.5 | |
| 8 | Honda Ridgeline | 2020 | 70/100 | Good | 7 | 49.1 | 5 | |
| 9 | GMC Yukon | 2018 | 68/100 | Good | 4 | 14.5 | 3.5 | |
| 10 | Ford Maverick | 2023 | 60/100 | Good | 20 | 32.7 | 4 |
Model Highlights
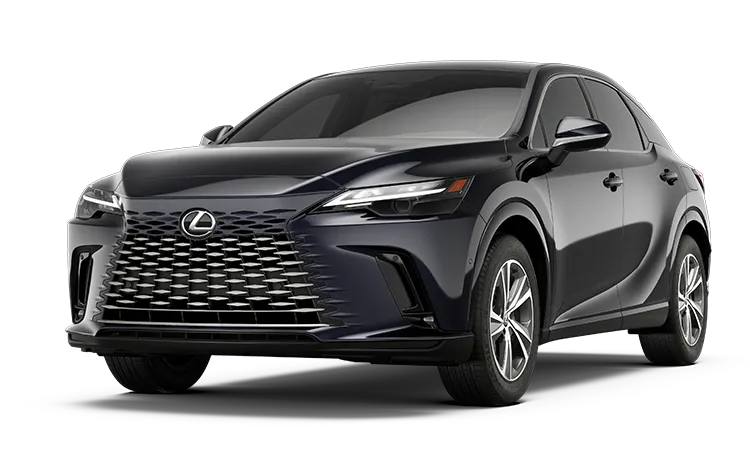
1. 2022 Lexus RX — 90/100
The Lexus RX, covering model years 2018 to 2026, has an average reliability score of 85/100, indicating an excellent reliability reputation according to Auto Reliability Index standards. Common issues reported by owners include problems with the electrical system, sunroof glass, and brake actuators, with varying complaint rates peaking in 2021 at 18.1 per 10,000 sold. This model is best suited for buyers prioritizing safety and reliability, although they should be aware of specific recurring issues such as electrical failures and sunroof malfunctions.
Best year: 2022 · Score: 90/100 · Recalls: 0 · Complaints: 35 · Avg across all years: 86/100
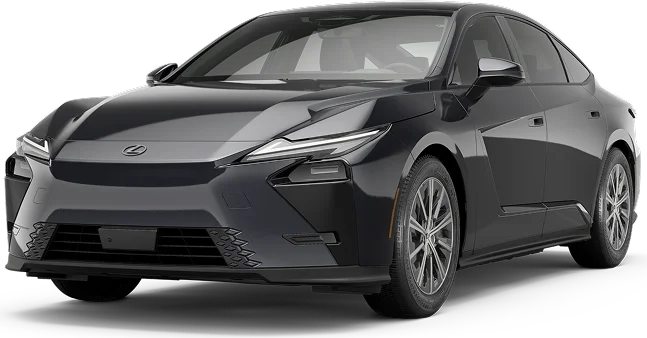
2. 2021 Lexus ES — 88/100
The Lexus ES, spanning model years 2018 to 2025, achieves an average reliability score of 83/100, indicating excellent reliability by Auto Reliability Index standards. Common issues reported by owners include problems with the fuel propulsion system, engine, and airbags, with notable occurrences in the 2019 and 2020 models. Repair costs are rated as good (4/5), making the Lexus ES a suitable option for those prioritizing reliability, though potential buyers should be aware of specific model-year concerns such as airbag and electronic system reliability.
Best year: 2021 · Score: 88/100 · Recalls: 0 · Complaints: 0 · Avg across all years: 83/100
3. 2021 KIA Sedona — 88/100
The KIA Sedona, covering model years 2018 to 2021, exhibits an average reliability score of 82/100, indicating an excellent reliability rating. Common issues reported by owners include engine problems, particularly in earlier models, electrical system malfunctions, and structural concerns such as sliding door failures. With an estimated annual repair cost of $495, which is below the minivan average of $647, the Sedona is suitable for those seeking a cost-effective vehicle, though potential buyers should be aware of recurring issues highlighted in owner complaints and safety reports.
Best year: 2021 · Score: 88/100 · Recalls: 0 · Complaints: 8 · Avg across all years: 82/100
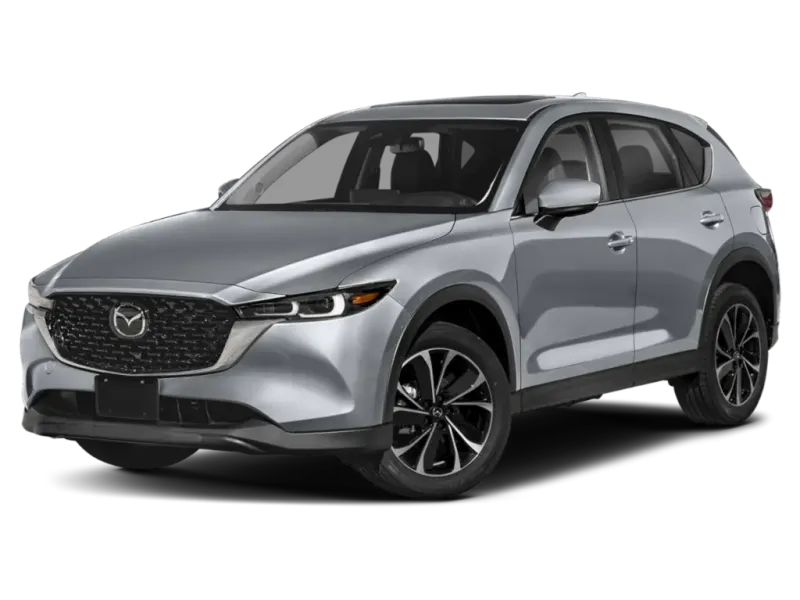
4. 2022 Mazda CX-5 — 87/100
The Mazda CX-5, covering model years 2018 to 2026, maintains an average reliability score of 93/100, categorized as excellent according to the Auto Reliability Index. Data indicates common issues with engine oil leaks and electrical system malfunctions, particularly in earlier models, while later versions show improved complaint rates, with the 2025 model reporting only 1.8 complaints per 10,000 sold. Owners benefit from a relatively low estimated annual repair cost of $447, compared to the segment average of $573, making it a reliable choice for those prioritizing cost-effective maintenance.
Best year: 2022 · Score: 87/100 · Recalls: 0 · Complaints: 50 · Avg across all years: 81/100
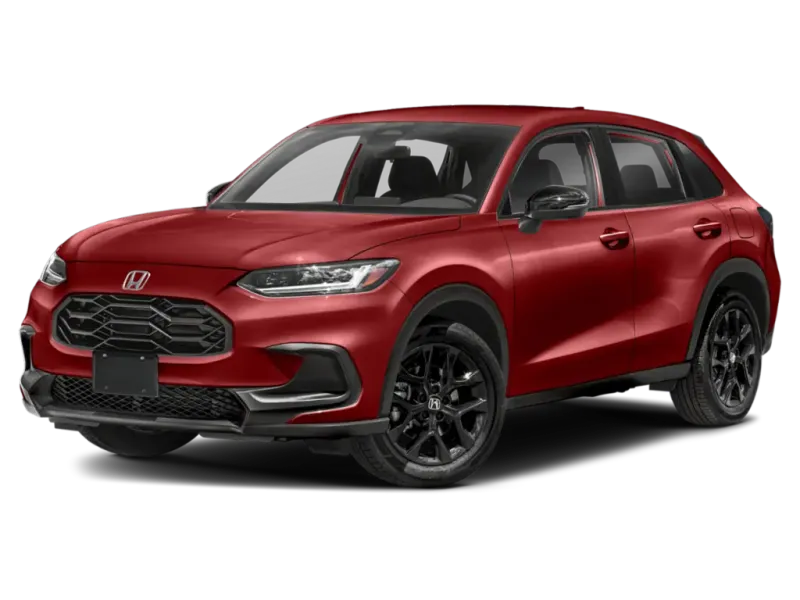
5. 2021 Honda HR-V — 86/100
The Honda HR-V, spanning model years 2018 to 2026, consistently scores highly in reliability, with an average score of 96 out of 100 and an estimated annual repair cost of $301, below the subcompact SUV average. Common issues reported by owners include electrical system malfunctions, particularly with the instrument cluster and fuel gauge, as well as recurring problems with the fuel system and powertrain in earlier models. Despite a spike in complaints for the 2023 model year, the HR-V generally maintains a strong reliability reputation, making it suitable for those seeking a dependable subcompact SUV with lower-than-average maintenance costs.
Best year: 2021 · Score: 86/100 · Recalls: 3 · Complaints: 52 · Avg across all years: 79/100
Frequently Asked Questions
- What is the most reliable used car?
- Based on our data, the 2022 Lexus RX is the most reliable used car with a score of 90/100 ("Excellent"). It has 0 recalls and 35 owner complaints.
- How are reliability scores calculated?
Every 0–100 score blends four weighted factors:
- Complaint Severity (35%) — owner complaints weighted by component type (powertrain and safety issues count 3× cosmetic ones) and normalized by sales volume.
- Repair Costs (30%) — independent data on repair frequency and average cost.
- Recall Impact (20%)— recall count weighted by severity. “Park It” recalls count 5×; “Park Outside” recalls count 3×.
- Issue Diversity (15%) — penalizes models with problems spread across many systems rather than concentrated in one.
When a sub-score has no data, the remaining weights redistribute proportionally.
- Should I buy a used car with a low reliability score?
- A low reliability score doesn't automatically mean a bad purchase, but it does indicate higher risk of problems. Vehicles scoring below 40 typically have elevated complaint rates in critical categories like powertrain, transmission, or braking systems — issues that tend to be expensive to repair. If you're considering a lower-scored vehicle, check the specific complaint breakdown on its detail page to understand whether the issues are safety-related or cosmetic. Budget for potential repairs, consider purchasing an extended warranty, and review the vehicle's recall history to confirm all open recalls have been addressed before buying.
- What categories of used cars are covered?
- We rank used cars across all major categories including sedans, SUVs, trucks, and minivans. Each category has its own dedicated ranking page where you can compare vehicles within the same segment. This is important because a sedan and an SUV have different mechanical complexity, weight, and typical use patterns — comparing them directly can be misleading. We also offer budget-focused rankings that filter by estimated price, so you can find the most reliable option within your specific price range.
- What is the most reliable used car on a budget?
- For budget buyers, the 2021 Chevrolet Trax offers the best reliability in the under-$15,000 price range, scoring 81/100. Prices are based on current dealer listings.
How We Calculate Reliability Scores
Auto Reliability Index scores are calculated on a 0–100 scale using a weighted formula that combines multiple public data sources. Each factor is weighted based on its predictive value for real-world ownership experience.
Key Ranking Factors
Complaint Severity
NHTSA owner complaints weighted by component category (e.g., powertrain, safety systems, electronics, cosmetic) — safety-critical issues carry more weight than cosmetic ones. Adjusted for sales volume so high-volume models aren't unfairly penalized.
Repair Costs
Independent reliability ratings based on repair frequency, average repair costs, and severity of typical repairs for each model.
Recall Impact
Number of NHTSA recalls weighted by severity. “Stop driving” and fire-risk recalls are penalized more heavily than minor software or labeling recalls.
Issue Diversity
Measures how many major vehicle systems (engine, transmission, electrical, braking, etc.) have recorded complaints. A vehicle with issues spread across many systems may indicate systemic quality issues.
Scores are grouped into four tiers:
- 80–100: Excellent— Top-tier reliability, minimal issues
- 60–79: Good— Reliable with some minor concerns
- 40–59: Mixed— Notable issues, research before buying
- 0–39: Risky— Significant problems, proceed with caution
Data is sourced from NHTSA recall records, owner complaint filings, and independent repair databases. Scores are recalculated as new data becomes available. While the weighting model is proprietary, all underlying data sources are public and traceable.
See incorrect data? Report an issue