Find the most reliable used cars
Every car gets a score from 0 to 100 based on NHTSA recalls, owner complaints, and independent repair data. No guesswork — just numbers.
1,527 vehicles analyzed·8,780 recalls tracked·Updated 2026-07-26
Find your match in 5 questions
Tell us your budget, body style, and how you drive. We'll surface the highest-scoring cars that actually fit.
Take the Quiz →Top 10 Most Reliable Cars of 2026
Based on analysis of recall records and real-world owner feedback.
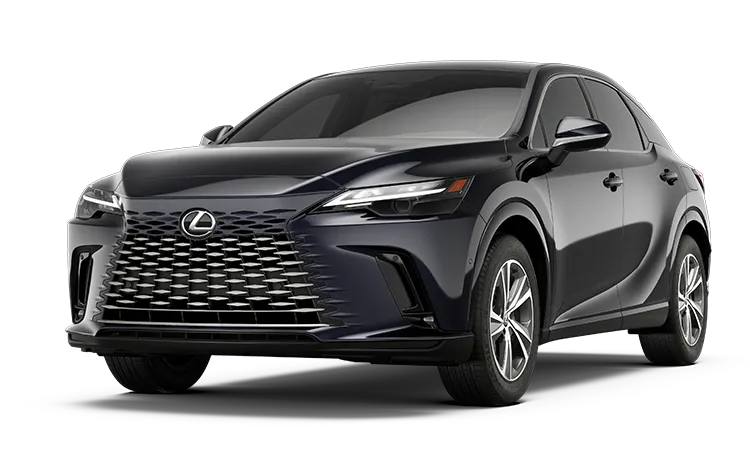
Lexus RX (2022)
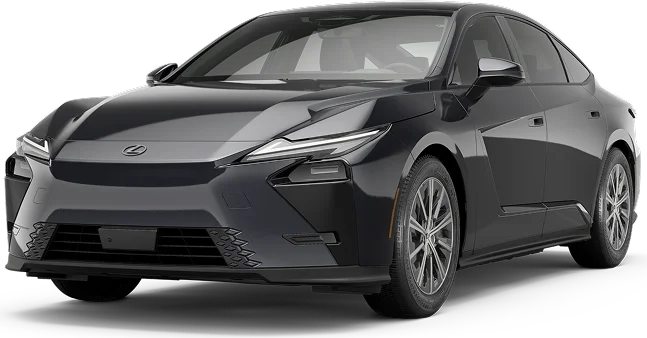
Lexus ES (2022)
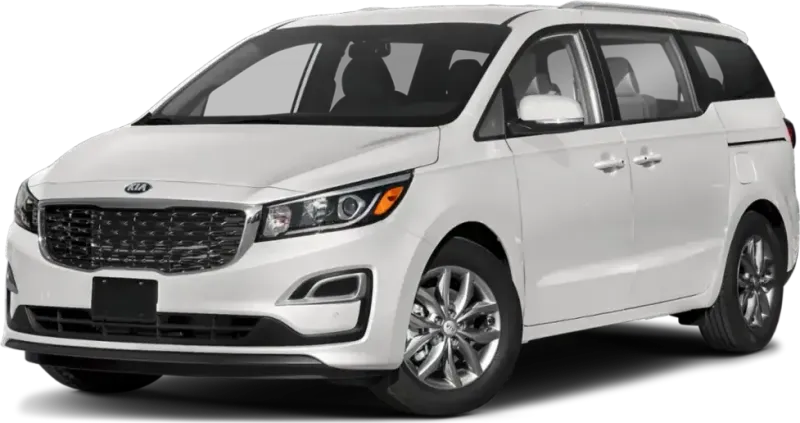
KIA Sedona (2021)
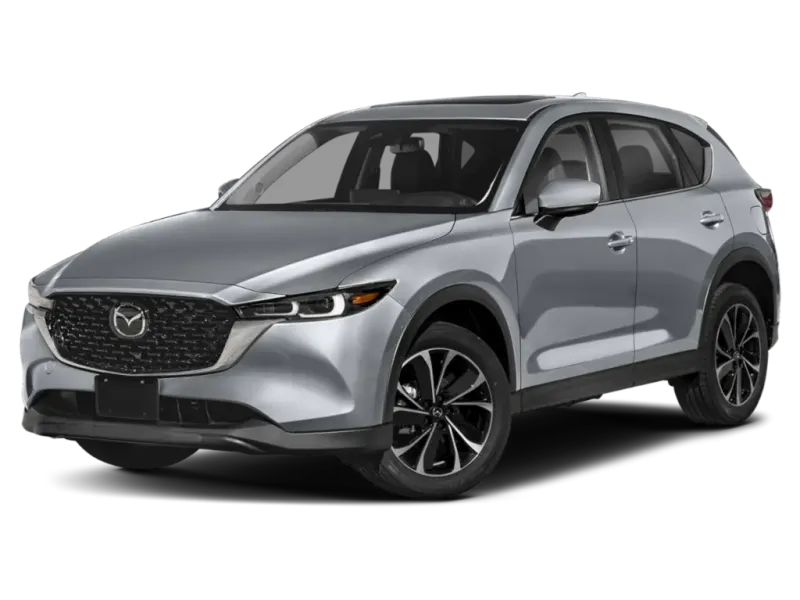
Mazda CX-5 (2022)
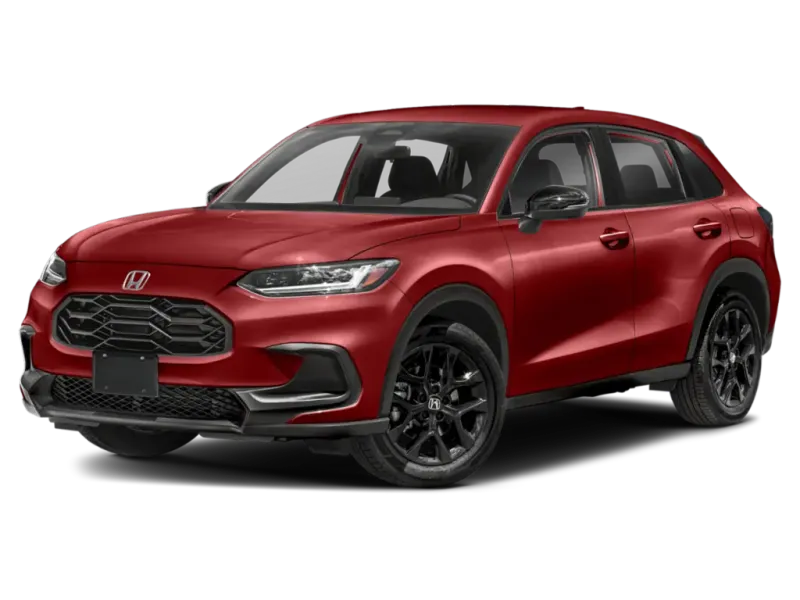
Honda HR-V (2021)
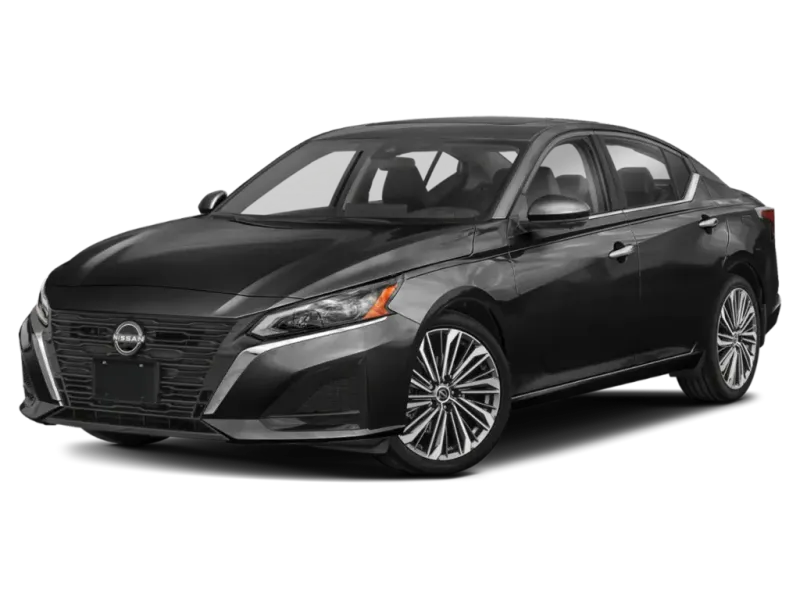
Nissan Altima (2023)
2023 Toyota Crown
0 recalls · 0 complaints
2021 Nissan Frontier
0 recalls · 0 complaints
2021 Mitsubishi Outlander
0 recalls · 0 complaints
2020 Lexus UX
0 recalls · 0 complaints
Considering a used car? Run its VIN to spot accident, title, and recall surprises before you buy.
Affiliate link — we may earn a commission at no cost to you.
Best in Class Winners
Best SedanLexus ES
2022
Best SUVLexus RX
2022
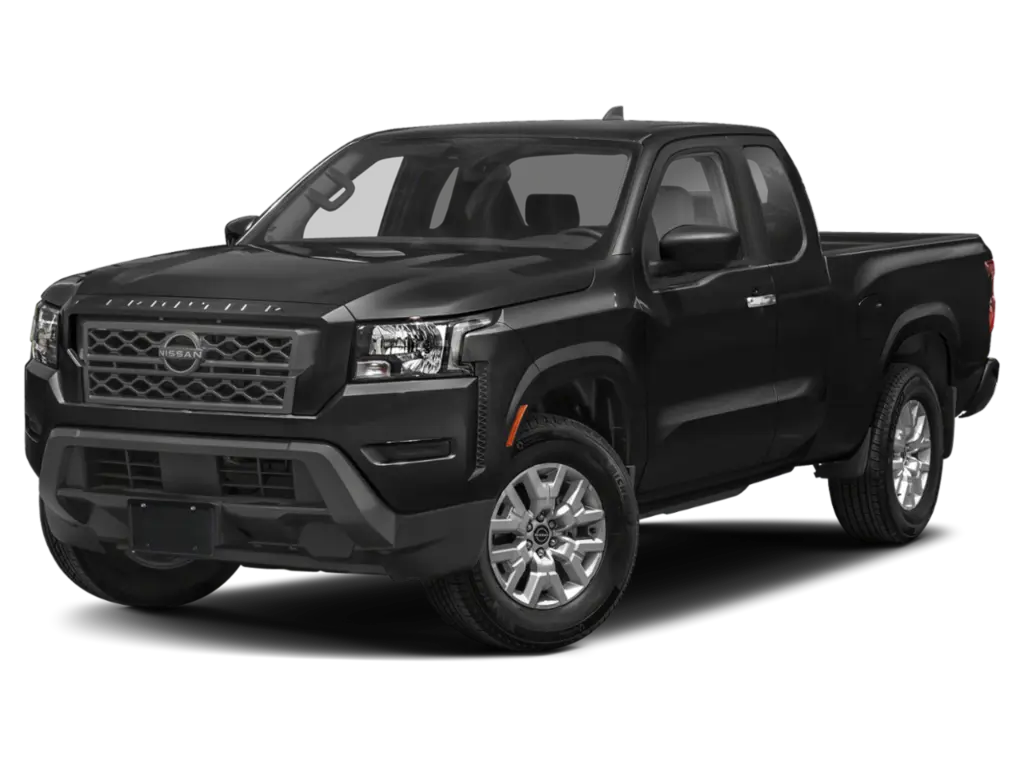 Best Truck
Nissan Frontier
2021
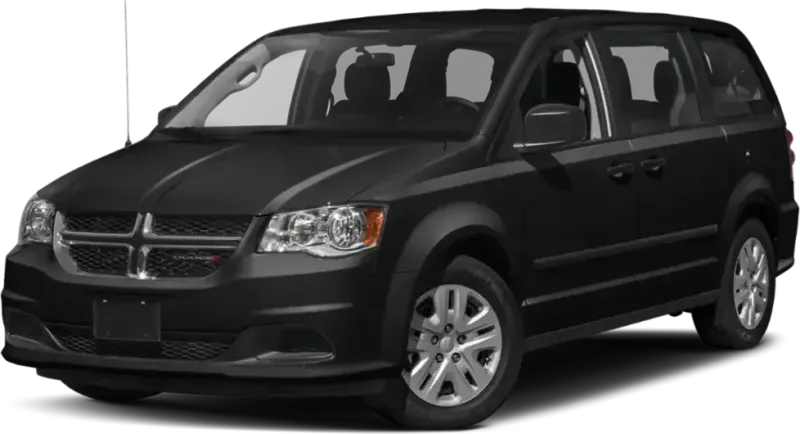 Best Minivan
Dodge Grand-Caravan
2020
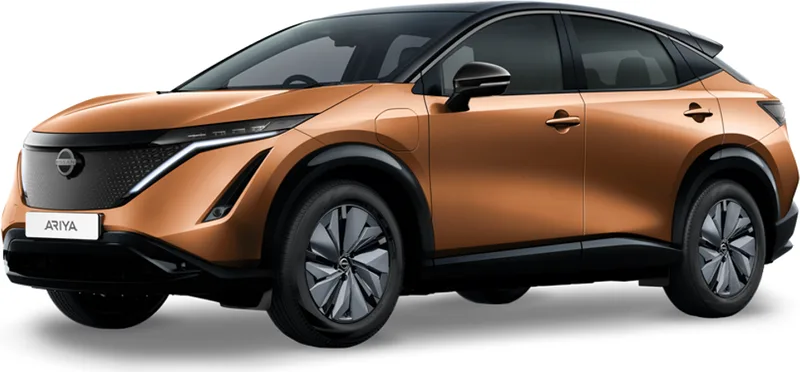 Best EV
Nissan Ariya
2023
Models & Years to Avoid
2023 Ford F-150 Lightning
Electrical System (71)
2019 Tesla Model S
Suspension (26)
2022 Volkswagen ID-4
Electrical System (44)
2023 Hyundai Ioniq 5
Electrical System (176)
2023 Ford Bronco
Visibility Wiper (84)
2023 Jeep Gladiator
Electrical System (11)
2023 KIA EV6
Electrical System (56)
2023 Mercedes-Benz EQS
Electrical System (16)
2023 Tesla Model Y
Forward Collision Avoidance (206)
Browse by Make

Acura
5 models

Audi
10 models

BMW
11 models

Buick
7 models

Cadillac
5 models

Chevrolet
15 models

Chrysler
3 models

Dodge
6 models

Ford
15 models

GMC
5 models

Genesis
5 models

Honda
9 models

Hyundai
10 models

Infiniti
1 model

Jeep
7 models

KIA
10 models

Land Rover
2 models

Lexus
7 models

Lincoln
3 models

Mazda
7 models

Mercedes-Benz
10 models

Mitsubishi
1 model

Nissan
12 models

Porsche
5 models

Ram
3 models

Rivian
2 models

Subaru
8 models

Tesla
5 models

Toyota
19 models

Volkswagen
8 models

Volvo
5 models
Popular Comparisons
View all comparisons →How We Calculate Reliability Scores
Auto Reliability Index scores are calculated on a 0–100 scale using a weighted formula that combines multiple public data sources. Each factor is weighted based on its predictive value for real-world ownership experience.
Key Ranking Factors
Complaint Severity
NHTSA owner complaints weighted by component category (e.g., powertrain, safety systems, electronics, cosmetic) — safety-critical issues carry more weight than cosmetic ones. Adjusted for sales volume so high-volume models aren't unfairly penalized.
Repair Costs
Independent reliability ratings based on repair frequency, average repair costs, and severity of typical repairs for each model.
Recall Impact
Number of NHTSA recalls weighted by severity. “Stop driving” and fire-risk recalls are penalized more heavily than minor software or labeling recalls.
Issue Diversity
Measures how many major vehicle systems (engine, transmission, electrical, braking, etc.) have recorded complaints. A vehicle with issues spread across many systems may indicate systemic quality issues.
Scores are grouped into four tiers:
- 80–100: Excellent— Top-tier reliability, minimal issues
- 60–79: Good— Reliable with some minor concerns
- 40–59: Mixed— Notable issues, research before buying
- 0–39: Risky— Significant problems, proceed with caution
Data is sourced from NHTSA recall records, owner complaint filings, and independent repair databases. Scores are recalculated as new data becomes available. While the weighting model is proprietary, all underlying data sources are public and traceable.