Last updated: 2026-10-10

Lincoln Reliability Ratings — Every Model Ranked
Good, but below average next to other brands on the site: that is where Lincoln lands as a used-car choice. All three models hold a good reliability standing, so the spread is small. The Nautilus leads the lineup. The Navigator trails it, and the Aviator sits between them in the model ranking.
The same trouble shows up across all three. Transmissions shift hard, and some lose power at highway speed. Engines can rattle at cold start, which dealers trace to the cam phasers. Electrical faults run from moonroof drains that come loose to liftgates that open on their own. Rearview camera screens also go black, and parts can take weeks. Before buying, test the shifts at low and highway speed, start the engine cold, and check the camera, liftgate, and moonroof area for water.
Lincoln Best Year Score Comparison
Each bar shows the best single model year score for that Lincoln model. Longer bars indicate higher peak reliability.
Lincoln Model Rankings
Scores below are averaged across all tracked model years. The “Best Year” column shows the highest-scoring model year that has been on the road for at least two years, where available.
| # | Vehicle | Best Year | Score | Rating | Recalls | Complaints / 10k | Maint. Rating | Est. Repair Cost |
|---|---|---|---|---|---|---|---|---|
| 1 | Lincoln Nautilus | 2023 | 72/100 | Good | 33 | 10.8 | 3.5 | |
| 2 | Lincoln Aviator | 2024 | 64/100 | Good | 116 | 16.7 | 3.5 | $807/yr |
| 3 | Lincoln Navigator | 2024 | 62/100 | Good | 68 | 13.7 | 2.5 | $1089/yr |
Lincoln Models
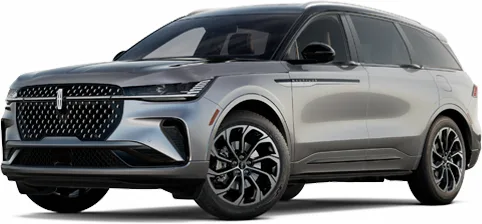
Lincoln Nautilus
2nd gen (2024–present)
Low-speed transmission shudder and instrument screens that go blank while driving are the main worries on a used Nautilus. The 2019 is the year to skip, and the 2023 is the better pick, with few complaints for the number sold.

Lincoln Aviator
2nd gen (2020–2023), facelifted 2025
Electronic door releases that stop working and trap passengers are the Aviator's biggest weak spot, and the 2020 model year adds transmissions that drop into neutral at highway speed. Reliability is rated good, though below average among SUVs on the site.

Lincoln Navigator
5th gen (2025–2023)
Used Navigators hold a good reliability standing, though they rank below average among SUVs on the site. The 2024 is the year to buy, while 2018 and 2019 draw the most complaints.
Common Lincoln Problems
Top complaint categories across all Lincoln models, based on owner-reported issues to NHTSA.
Frequently Asked Questions
- What is the most reliable Lincoln model?
- The Nautilus is the most reliable Lincoln on the site. It also has the fewest federal recalls of the three models. The 2023 is the better year to buy, and the 2019 is the one to skip. Watch for transmission shudder at low speed and instrument screens that go blank.
- Which Lincoln models and years should I avoid?
- Skip the 2019 Nautilus and the 2020 Aviator. The Aviator's 2020 year adds transmissions that drop into neutral at highway speed. The Navigator ranks last among Lincolns, and its 2018 and 2019 years draw the most complaints. The 2023 Nautilus and 2024 Navigator and Aviator are the better picks.
- Are Lincoln vehicles expensive to repair?
- Repair costs look moderate for the models with data. Independent repair-cost data puts the Navigator at about $1,089 a year and the Aviator at about $807. The big risk is a major repair. A replacement Nautilus transmission has been quoted at $7,000 to $9,000.
- What is the most common problem with Lincoln vehicles?
- Transmission trouble is the most common. Owners describe shifts that slam hard, often from first to third, and reverse that slips. At highway speed, some trucks lurch, show a "Manual Shifting" message, or lose power at the wheels. Dealers often find no codes, and reprogramming does not always cure it.
- Why do some Lincoln engines rattle at cold start?
- Dealers trace the cold-start rattle to the cam phasers. It is the main engine complaint across the brand, and rough idle and lost power can come with it. Several owners say the rattle came back after software updates or phaser replacement, so listen to any used one start cold.
Compare Lincoln vs Other Makes

Lincoln vs Acura
Compare reliability →

Lincoln vs Audi
Compare reliability →

Lincoln vs BMW
Compare reliability →

Lincoln vs Buick
Compare reliability →

Lincoln vs Cadillac
Compare reliability →

Lincoln vs Chevrolet
Compare reliability →

Lincoln vs Chrysler
Compare reliability →

Lincoln vs Ford
Compare reliability →

Lincoln vs GMC
Compare reliability →

Lincoln vs Genesis
Compare reliability →

Lincoln vs Honda
Compare reliability →

Lincoln vs Hyundai
Compare reliability →

Lincoln vs Infiniti
Compare reliability →

Lincoln vs Jeep
Compare reliability →

Lincoln vs Kia
Compare reliability →

Lincoln vs Land Rover
Compare reliability →

Lincoln vs Lexus
Compare reliability →

Lincoln vs Mazda
Compare reliability →

Lincoln vs Mercedes-Benz
Compare reliability →

Lincoln vs Nissan
Compare reliability →

Lincoln vs Porsche
Compare reliability →

Lincoln vs Ram
Compare reliability →

Lincoln vs Subaru
Compare reliability →

Lincoln vs Toyota
Compare reliability →

Lincoln vs Volkswagen
Compare reliability →

Lincoln vs Volvo
Compare reliability →
Most Reliable Used SUVs
View rankings →
Best Lincoln Years
View rankings →
How we score Lincoln models
Scores weight complaint severity at 35%, repair costs at 30%, recall impact at 20%, and the spread of complaints across systems at 15%, with complaint counts adjusted for US sales. Read the full methodology.
See incorrect data? Report an issue