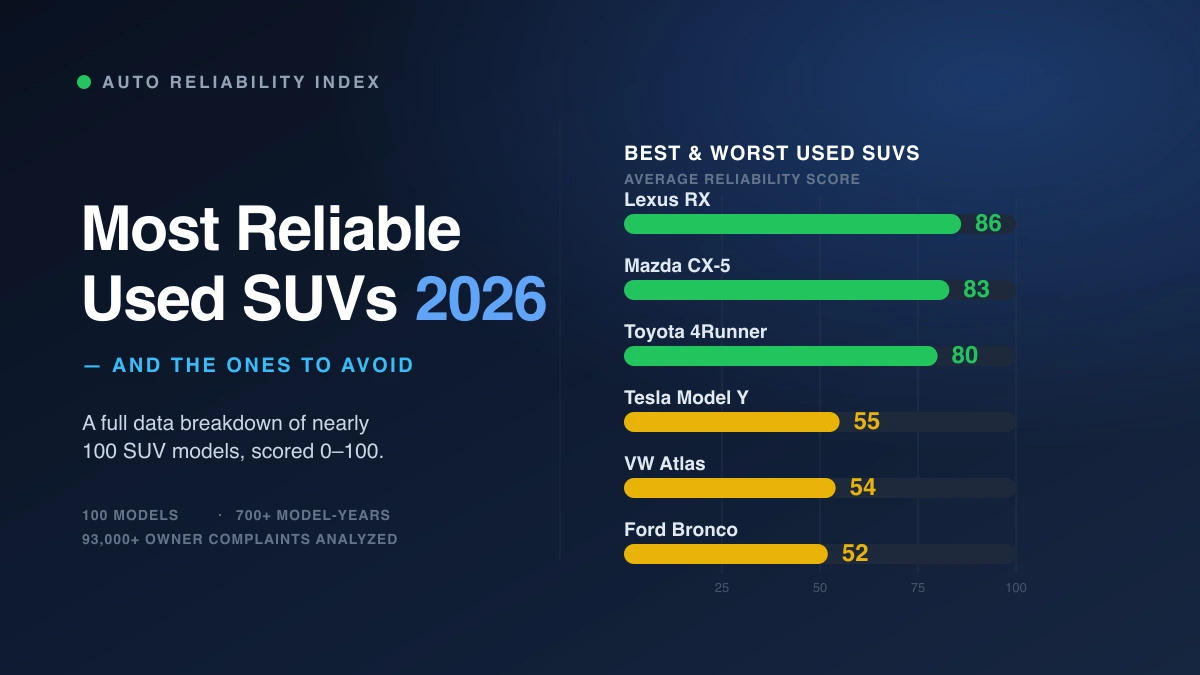
Audi Reliability: What 63 Model-Years of Data Actually Show
We scored 9 Audi models across 63 model-years on a 0-100 reliability scale using NHTSA recalls, complaint severity, and repair cost data. Here's what the numbers say about Audi reliability.
Original data analysis on vehicle reliability — powered by our database of 80+ scored models.

We scored 9 Audi models across 63 model-years on a 0-100 reliability scale using NHTSA recalls, complaint severity, and repair cost data. Here's what the numbers say about Audi reliability.
Interactive scatter plot comparing sales popularity vs NHTSA reliability data for 115+ used car models. The most popular used cars score well below the fleet average. The least popular score well above it.

We scored 10 of America's best-selling vehicles on a 0-100 reliability scale using NHTSA data and repair costs. Half scored below 60. Here's the full breakdown.

We scored Japanese and German vehicles on a 0-100 reliability scale using recall data, complaint rates, and repair costs. Here's how the two automotive powerhouses actually compare.

We compared public perception against reliability scores for 80+ vehicles. These 10 had the biggest gaps between reputation and data.