Last updated: 2026-07-26

KIA Reliability Ratings — Every Model Ranked
KIA offers generally reliable vehicles, though reliability varies across models and years. Most KIA models fall within the "Good" range, making them a reasonable choice for buyers who prioritize dependability.
KIA Best Year Score Comparison
Each bar shows the best single model year score for that KIA model. Longer bars indicate higher peak reliability.
KIA Model Rankings
Scores below are averaged across all tracked model years. The “Best Year” column shows which year scored highest.
| # | Vehicle | Best Year | Score | Rating | Recalls | Complaints / 10k | Maint. Rating | Est. Repair Cost |
|---|---|---|---|---|---|---|---|---|
| 1 | KIA Carnival | 2025 | 83/100 | Excellent | 10 | 1.3 | 4 | |
| 2 | KIA Sedona | 2021 | 82/100 | Excellent | 6 | — | 4 | $495/yr |
| 3 | KIA Soul | 2024 | 77/100 | Good | 10 | 17.6 | 4.5 | $437/yr |
| 4 | KIA K5 | 2026 | 75/100 | Good | 20 | 11.2 | 4 | |
| 5 | KIA Sportage | 2026 | 75/100 | Good | 28 | 8.5 | 4 | $462/yr |
| 6 | KIA Seltos | 2026 | 73/100 | Good | 7 | 18.9 | 3.5 | |
| 7 | KIA Forte | 2024 | 72/100 | Good | 11 | 6.6 | 3 | $451/yr |
| 8 | KIA Sorento | 2026 | 71/100 | Good | 43 | 18.4 | 4 | $533/yr |
| 9 | KIA Telluride | 2025 | 66/100 | Good | 27 | 25.9 | 3.5 | $573/yr |
| 10 | KIA EV6 | 2025 | 57/100 | Mixed | 8 | 48.9 | 1.5 |
KIA Models
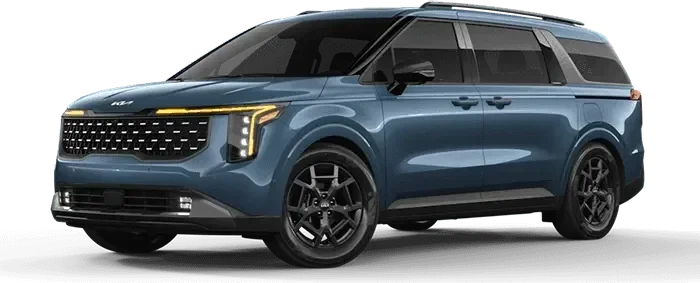
KIA Carnival
2nd gen (2006–2012), facelifted 2011
The KIA Carnival, covering model years 2022 to 2026, has an average reliability score of 83/100, categorized as excellent, with a reliability rating of 4/5. Common issues reported by owners include power sliding door malfunctions, electrical system failures, and power train problems, particularly affecting speed control and acceleration.

The KIA Sedona, covering model years 2018 to 2021, exhibits an average reliability score of 82/100, indicating an excellent reliability rating. Common issues reported by owners include engine problems, particularly in earlier models, electrical system malfunctions, and structural concerns such as sliding door failures.
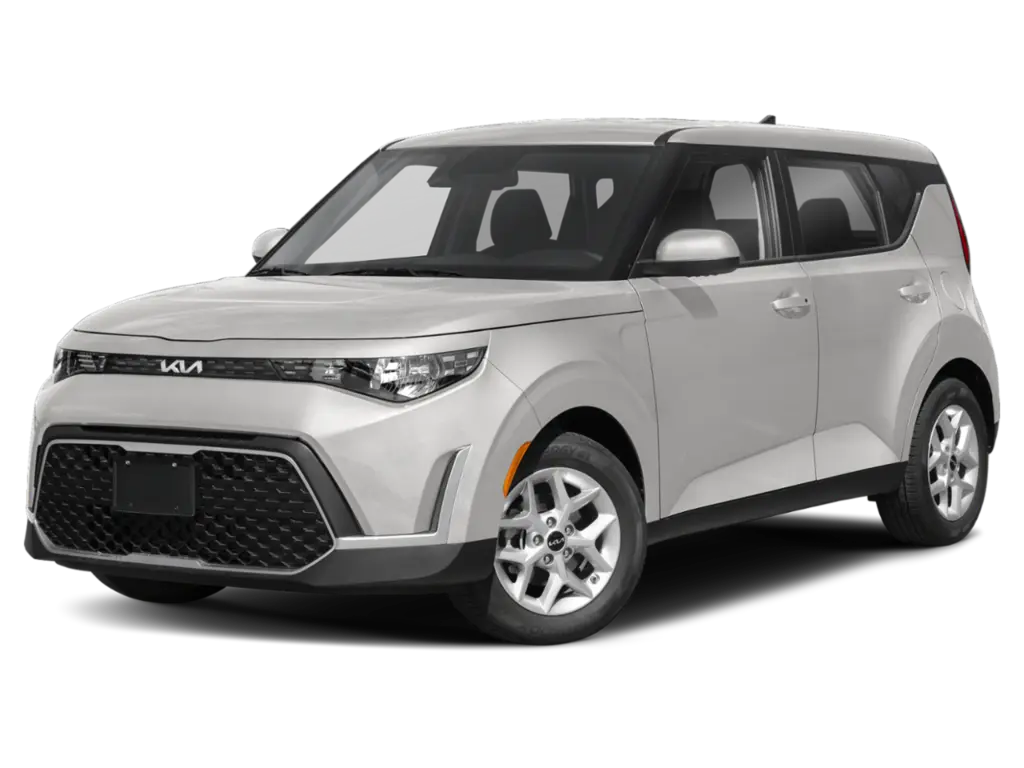
KIA Soul
3rd gen (2020–present), facelifted 2023
The Kia Soul, spanning model years 2018 to 2025, holds an average reliability score of 77/100, categorized as "Good" according to Auto Reliability Index standards. Data indicates common issues with engine performance, particularly in earlier models, with a notable improvement in complaint rates by 2025, reaching a low of 1.8 complaints per 10,000 sold.
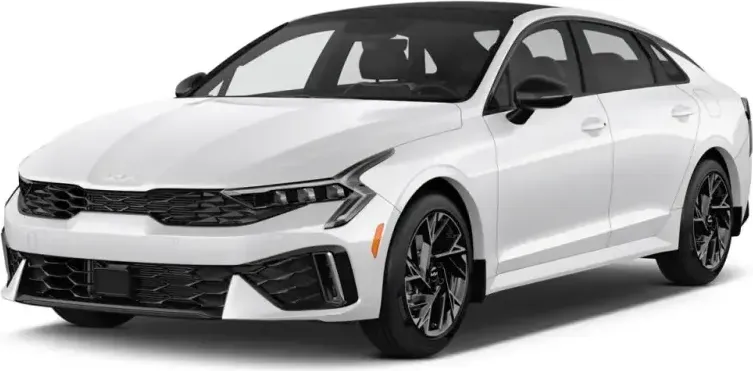
KIA K5
5th gen (2021–2023), facelifted 2025
The Kia K5, spanning model years 2021 to 2026, shows a notable improvement in reliability, with scores increasing from 75/100 in 2021 to 100/100 in 2026. Initial years exhibit issues primarily with the electrical and fuel systems, while later models, particularly 2024 onward, demonstrate significantly fewer complaints and higher reliability scores, suggesting improvements in design and manufacturing.
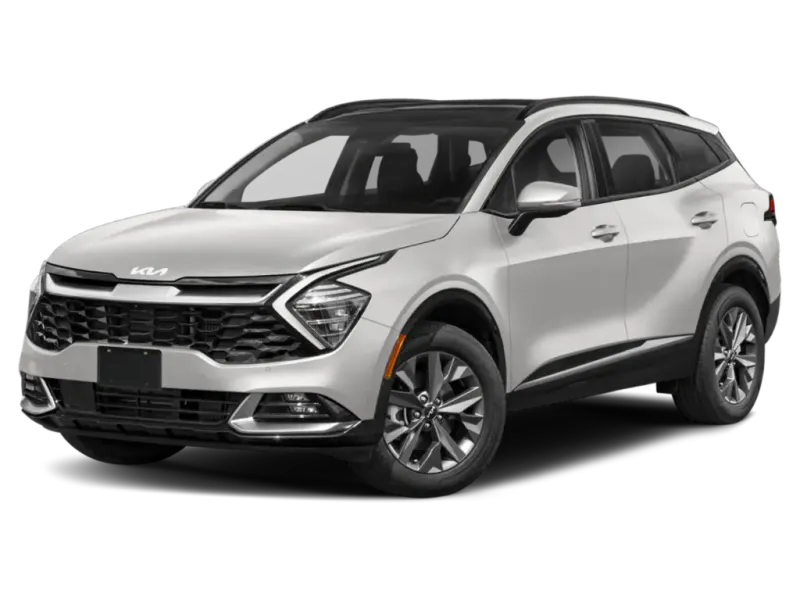
KIA Sportage
5th gen (2023–2023)
The Kia Sportage, with an average reliability score of 73/100, is categorized as having good reliability, although specific model years like 2023 and 2026 show higher complaint rates and lower scores. Common issues reported by owners include engine and electrical system problems, particularly in earlier models, while the vehicle's estimated annual repair cost is $462, below the compact SUV average.
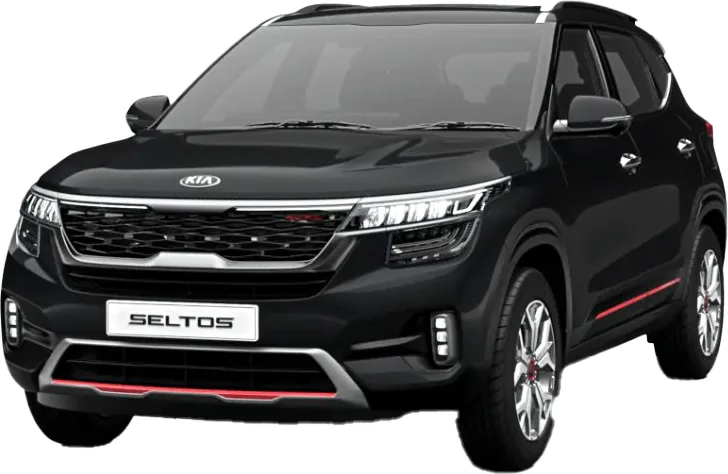
KIA Seltos
2nd gen (2027–present)
Data indicates that the KIA Seltos, covering model years 2021 to 2026, has an average reliability score of 73/100, categorizing it as a good choice in terms of reliability. Common issues reported by owners include engine and electrical system problems, particularly in earlier models, with significant improvements noted by 2026, which scores 82/100 and has fewer complaints.
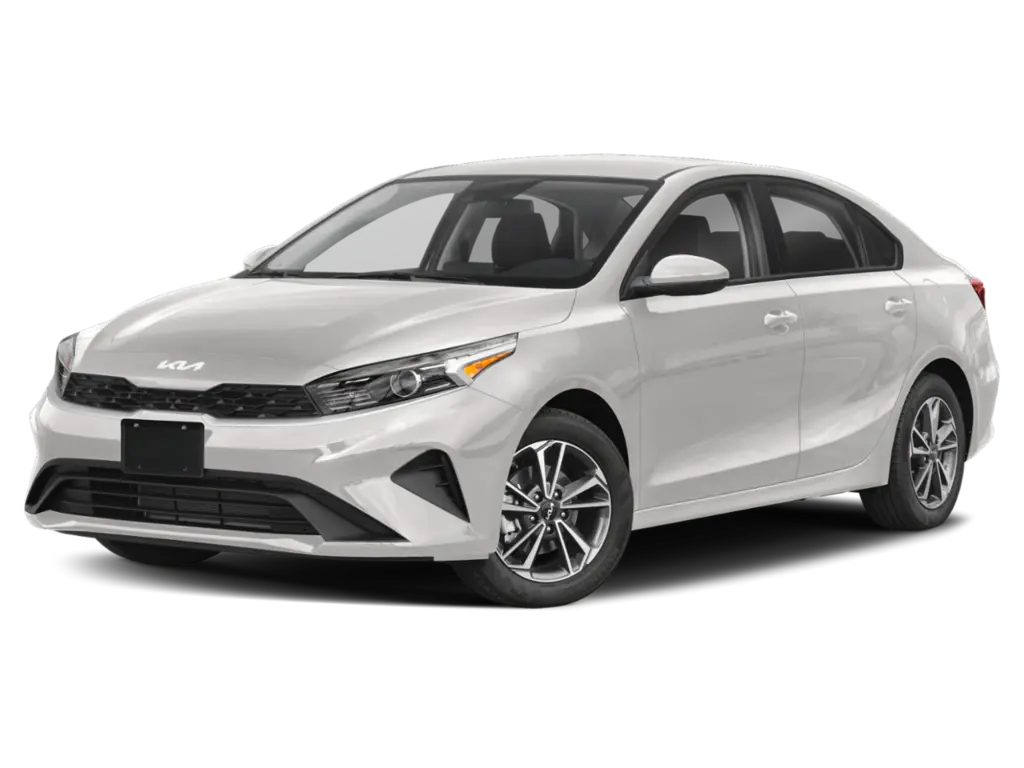
KIA Forte
3rd gen (2019–2024), facelifted 2021
The KIA Forte, covering model years 2018 through 2024, maintains an average reliability score of 81/100, indicating excellent reliability overall, with a notable improvement in complaint rates from 13.1 per 10,000 sold in 2018 to 1.6 in 2024. Common issues reported include engine and electrical system problems, particularly in earlier years, while later models show reduced complaints and no recalls in 2024.
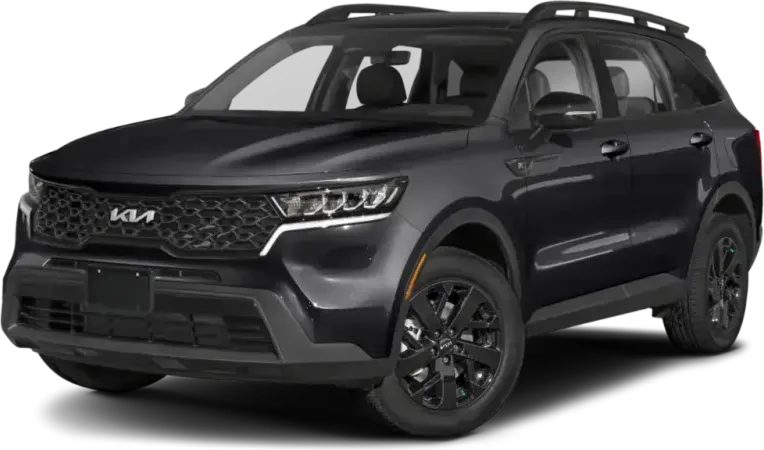
KIA Sorento
4th gen (2021–2023), facelifted 2024
The Kia Sorento, covering model years 2018 to 2026, presents an average reliability score of 81 out of 100, indicating an excellent reliability reputation. Common issues reported by owners include engine and powertrain problems, particularly in earlier models, with a noted improvement in complaint rates by 2026.

KIA Telluride
1st gen (2020–present), facelifted 2023
The Kia Telluride, covering model years 2020 through 2025, holds an average reliability score of 71/100, classified as "Good," with a medium reliability rating of 3.5/5. Data indicates common issues such as windshield cracking and electrical system malfunctions, with annual repair costs estimated at $573.
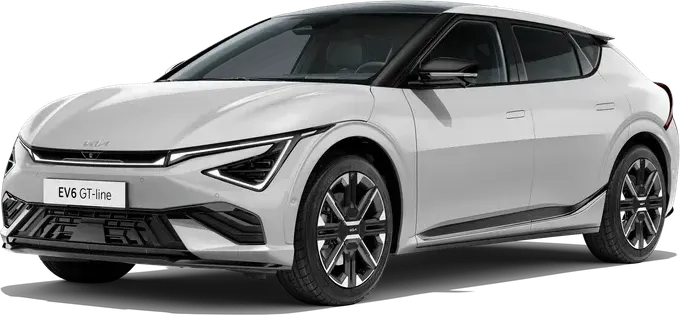
KIA EV6
1st gen (2022–2024), facelifted 2025
The Kia EV6, covering model years 2022 through 2026, has an average reliability score of 75 out of 100, indicating a generally good reliability reputation. Data shows early models, particularly the 2022 version, have notable issues with the electrical system and power train, resulting in high complaint rates and multiple recalls, while later models, especially from 2025 onward, exhibit significant improvements with perfect scores and no reported issues.
Common KIA Problems
Top complaint categories across all KIA models, based on owner-reported issues to NHTSA.
KIA by Category
Frequently Asked Questions
- Are KIA cars reliable?
- KIA vehicles have an average reliability score of 73/100 ("Good") across 10 models and 9 years in our database. KIA offers generally reliable vehicles, though reliability varies across models and years.
- What is the most reliable KIA?
- Based on our data, the highest-scoring KIA model-year is the 2025 KIA Carnival at 88/100. Scores can change as new recalls and complaints are filed. See our full KIA reliability rankings for the latest data.
- How much does it cost to maintain a KIA?
- Annual repair costs for KIA models range from $437 to $573 based on independent reliability data. Costs vary significantly by model and year.
- Which KIA models should I avoid?
- Based on our data, these KIA models are statistical outliers within their model lines: 2021 Soul (72/100), 2020 Soul (70/100), 2022 K5 (69/100), 2018 Sportage (68/100), 2023 Sportage (67/100). These have higher recall counts or complaint volumes relative to their siblings.
Compare KIA vs Other Makes

KIA vs Acura
Compare reliability →

KIA vs Audi
Compare reliability →

KIA vs BMW
Compare reliability →

KIA vs Buick
Compare reliability →

KIA vs Cadillac
Compare reliability →

KIA vs Chevrolet
Compare reliability →

KIA vs Chrysler
Compare reliability →

KIA vs Dodge
Compare reliability →

KIA vs Ford
Compare reliability →

KIA vs GMC
Compare reliability →

KIA vs Genesis
Compare reliability →

KIA vs Honda
Compare reliability →

KIA vs Hyundai
Compare reliability →

KIA vs Infiniti
Compare reliability →

KIA vs Jeep
Compare reliability →

KIA vs Land Rover
Compare reliability →

KIA vs Lexus
Compare reliability →

KIA vs Lincoln
Compare reliability →

KIA vs Mazda
Compare reliability →

KIA vs Mercedes-Benz
Compare reliability →

KIA vs Mitsubishi
Compare reliability →

KIA vs Nissan
Compare reliability →

KIA vs Porsche
Compare reliability →

KIA vs Ram
Compare reliability →

KIA vs Rivian
Compare reliability →

KIA vs Subaru
Compare reliability →

KIA vs Tesla
Compare reliability →

KIA vs Toyota
Compare reliability →

KIA vs Volkswagen
Compare reliability →

KIA vs Volvo
Compare reliability →
Most Reliable Used SUVs
View rankings →
Most Reliable Used Sedans
View rankings →
Best KIA Years
View rankings →
How We Calculate Reliability Scores
Auto Reliability Index scores are calculated on a 0–100 scale using a weighted formula that combines multiple public data sources. Each factor is weighted based on its predictive value for real-world ownership experience.
Key Ranking Factors
Complaint Severity
NHTSA owner complaints weighted by component category (e.g., powertrain, safety systems, electronics, cosmetic) — safety-critical issues carry more weight than cosmetic ones. Adjusted for sales volume so high-volume models aren't unfairly penalized.
Repair Costs
Independent reliability ratings based on repair frequency, average repair costs, and severity of typical repairs for each model.
Recall Impact
Number of NHTSA recalls weighted by severity. “Stop driving” and fire-risk recalls are penalized more heavily than minor software or labeling recalls.
Issue Diversity
Measures how many major vehicle systems (engine, transmission, electrical, braking, etc.) have recorded complaints. A vehicle with issues spread across many systems may indicate systemic quality issues.
Scores are grouped into four tiers:
- 80–100: Excellent— Top-tier reliability, minimal issues
- 60–79: Good— Reliable with some minor concerns
- 40–59: Mixed— Notable issues, research before buying
- 0–39: Risky— Significant problems, proceed with caution
Data is sourced from NHTSA recall records, owner complaint filings, and independent repair databases. Scores are recalculated as new data becomes available. While the weighting model is proprietary, all underlying data sources are public and traceable.
See incorrect data? Report an issue