Audi occupies an interesting spot in the luxury market. It's not the most expensive, not the cheapest, and — depending on who you ask — either surprisingly reliable or a ticking time bomb once the warranty expires. We ran every Audi in our database through the AutoReliabilityIndex scoring system to find out which narrative the data supports.
The answer is more nuanced than either camp suggests.
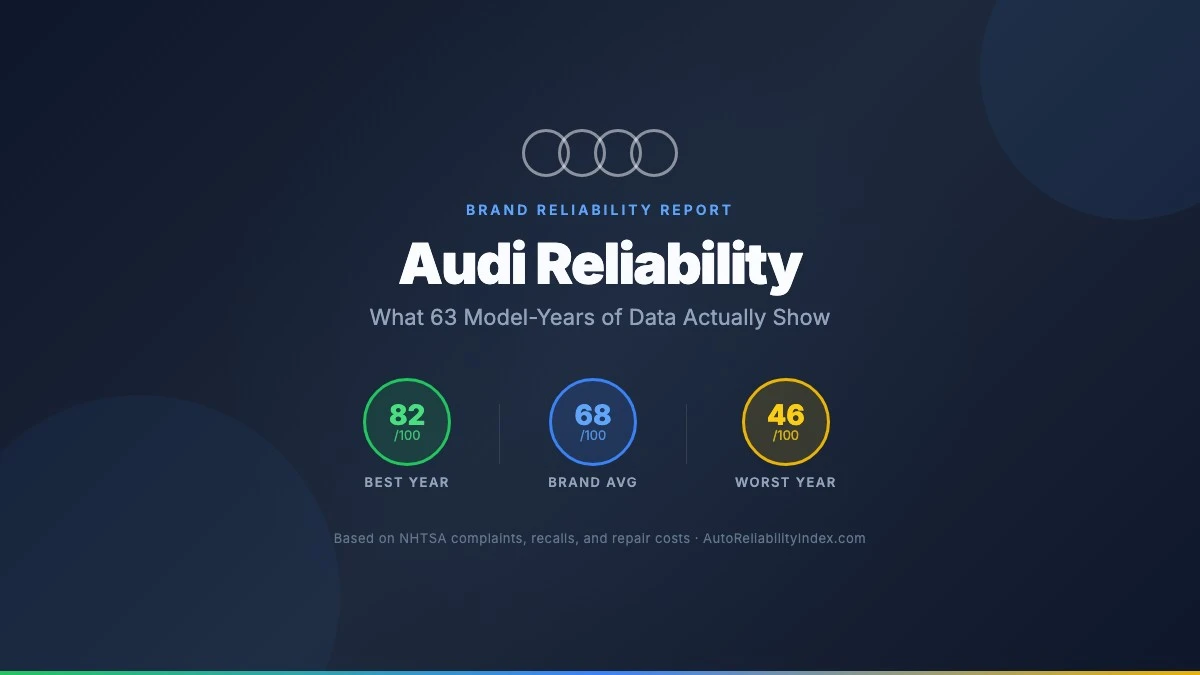
Audi's Overall Reliability Score
Across 9 models and 63 model-years (2018–2026), Audi averages a reliability score of 67.6 out of 100 — placing it squarely in the Good range. That puts Audi ahead of BMW (65.7), Porsche (63.6), Genesis (64.6), and Mercedes-Benz (60.0) among luxury brands in our database. But it trails Lexus (81.8) by a wide margin and sits behind Acura (74.6) and Volvo (69.7) as well.
In total, Audi models in our database have accumulated 327 recalls and 1,655 NHTSA complaints across the model-years we track.
How the AutoReliabilityIndex Works
Every vehicle receives a composite score from 0 to 100, calculated from four weighted data sources:
- Complaint severity (35%) — owner-filed complaints with NHTSA, weighted by component type (engine/powertrain issues count 3x, brakes/steering 2x, cosmetic issues 0.5x) and normalized by sales volume
- Independent repair cost data (30%) — annual maintenance costs, repair frequency, and severity across thousands of service records
- Recall impact (20%) — the number and seriousness of manufacturer-issued safety recalls, with park-it and park-outside recalls weighted more heavily
- Issue diversity (15%) — the breadth of distinct complaint categories, penalizing vehicles with problems spread across many systems
Scores of 80+ indicate excellent reliability, 60–79 is good, 40–59 is mixed, and below 40 is poor. See our About page for the full methodology.
Audi's Most Reliable Models
Not all Audis are created equal. Here's how each model stacks up by average reliability score:
Top Performers
Audi A5 — 75.6 average (Good). Audi's most reliable model in our database. The A5 benefits from a mature platform shared with the A4, relatively low complaint rates, and annual repair costs around $739. Its best year — 2026 — scores 82, crossing into Excellent territory. The 2023 model year also scores 81 with zero recalls and zero complaints.
Audi Q3 — 73.9 average (Good). Audi's smallest SUV punches above its weight in reliability. Like other compact luxury vehicles, it benefits from relative mechanical simplicity. Annual repair costs average $859, and its 2026 model year scores 82.
Audi A4 — 72.8 average (Good). The A4 is Audi's bread-and-butter sedan. Scores range from 65 (2020) to 81 (2025), with the 2020 model year dragged down by a wave of infotainment system complaints. The A4 shares its $739 annual repair cost estimate with the A5.


Middle of the Pack
Audi Q5 — 69.4 average (Good). Audi's best-selling SUV lands in the upper 60s. It carries the highest complaint count of any Audi model (471 complaints) and 49 total recalls across model-years we track. Annual repair costs run $928. Recent years (2025–2026) show improvement, both scoring 76.
Audi E-Tron GT — 67.8 average (Good). Audi's performance EV sedan averages in the upper 60s despite only 21 complaints, because it carries a heavy recall burden — 46 recalls across just 4 model-years. When a recall hits an EV, it tends to affect the entire model due to shared battery and software architectures.
Audi Q8 E-Tron — 76.5 average (Good). A newer model with limited data (2 model-years), the Q8 E-Tron scores in the mid-70s so far. Zero complaints filed, though its 2 recalls keep it from scoring higher.


Models to Watch
Audi Q7 — 65.0 average (Good). The three-row SUV slides into the lower end of "Good." Annual repair costs of $1,185 — the highest of any Audi — reflect its mechanical complexity. The 2018 Q7 is the worst-scoring gas Audi in our database (58) with 134 complaints.
Audi Q8 — 63.6 average (Good). The coupe-style SUV underperforms, with 43 recalls and 180 complaints across 8 model-years. Its 2019 model year scores just 53, dragged down by 103 complaints — many focused on electronic systems. Annual repair costs average $1,127.
Audi E-Tron — 51.0 average (Mixed). Audi's first mass-market EV is the weakest link in the lineup, averaging just 51 — the only Audi model in Mixed reliability territory. It carries 106 recalls (the most of any Audi), 240 complaints, 6 fire incidents, and 17 crash reports across 8 model-years. The E-Tron's struggles are a cautionary tale about first-generation EV platforms.


Best and Worst Audi Model Years
The best Audi model-years in our database all come from 2023 or later — a clear sign that reliability is trending upward:
| Model | Year | Score | Recalls | Complaints |
|---|---|---|---|---|
| A5 | 2026 | 82 | 0 | 0 |
| Q3 | 2026 | 82 | 0 | 0 |
| A4 | 2025 | 81 | 0 | 0 |
| A5 | 2023 | 81 | 0 | 0 |
| Q8 E-Tron | 2025 | 78 | 0 | 0 |
The worst years are dominated by the E-Tron and older, more complex SUVs:
| Model | Year | Score | Recalls | Complaints |
|---|---|---|---|---|
| E-Tron | 2023 | 46 | 22 | 30 |
| E-Tron | 2024 | 48 | 16 | 23 |
| E-Tron | 2019 | 48 | 5 | 71 |
| E-Tron | 2022 | 49 | 32 | 52 |
| Q8 | 2019 | 53 | 5 | 103 |
Common Audi Reliability Issues
Across all 1,655 complaints in our database, several patterns emerge:
Infotainment / MMI System Failures
The single biggest complaint driver for Audi is the MMI (Multi Media Interface) system. The 2020 A4 alone has 109 complaints about the MMI rebooting during driving, disabling the backup camera, navigation, and collision avoidance systems. This issue affects multiple models and years, though Audi has largely addressed it in 2022+ vehicles.
Electrical System Problems
Electrical issues appear across nearly every model, from instrument cluster failures (2021 A4, A5) to gateway module failures (2021 A5) to sensor malfunctions. These complaints often involve safety-critical systems like adaptive cruise control and collision avoidance.
EV-Specific Recalls
The E-Tron and E-Tron GT carry outsized recall counts — 106 and 46 respectively — driven by battery management, charging system, and software issues common to early EV platforms. These recalls have improved over time as Audi has iterated on its electric architecture.
Powertrain and AWD Clutch
Several A4 and A5 owners report vibration and shuddering from the AWD clutch system, typically appearing between 30,000–50,000 miles. Front differential failures are less common but more expensive when they occur.
Audi vs Other Luxury Brands
Here's how Audi compares to every luxury brand in our database:
| Brand | Avg Score | Rating | Models Tracked |
|---|---|---|---|
| Lexus | 81.8 | Excellent | 47 model-years |
| Acura | 74.6 | Good | 28 model-years |
| Volvo | 69.7 | Good | 38 model-years |
| Audi | 67.6 | Good | 63 model-years |
| BMW | 65.7 | Good | 72 model-years |
| Porsche | 63.6 | Good | 37 model-years |
| Genesis | 64.6 | Good | 14 model-years |
| Mercedes-Benz | 60.0 | Good | 56 model-years |
Audi finishes 4th of 8 luxury brands — solidly mid-pack among European competitors, but well behind the Japanese luxury brands. Within the German trio (Audi, BMW, Mercedes-Benz), Audi leads by 2–8 points on average.
Repair Costs: What to Expect
Annual repair cost estimates vary significantly across the Audi lineup:
| Model | Annual Cost | Repair Rating |
|---|---|---|
| A4 | $739 | 3.5/5 |
| A5 | $739 | 3.5/5 |
| Q3 | $859 | 3.5/5 |
| Q5 | $928 | 3.0/5 |
| Q8 | $1,127 | 2.5/5 |
| Q7 | $1,185 | 2.5/5 |
The sedans (A4, A5) are materially cheaper to maintain than the SUVs, with the Q7 and Q8 costing roughly 60% more per year. This size-to-cost correlation is consistent across German luxury brands — larger vehicles with more complex drivetrains, air suspensions, and electronic systems drive higher maintenance bills.
For comparison, a Toyota Camry runs about $388/year and a Lexus RX about $551/year.
The Reliability Trend: Are Audis Getting Better?
The data suggests yes. Looking at average scores by model-year:
- 2018–2020 average: Scores cluster in the low-to-mid 60s, with the E-Tron and Q8 pulling the brand down
- 2021–2023 average: Mid 60s to low 70s, as early EV issues persist but gas models improve
- 2024–2026 average: Upper 70s for gas models, with the A5, Q3, and A4 all posting their best-ever scores
The pattern is clear: if you're shopping for a used Audi, newer is generally better — particularly for the gas-powered sedans and compact SUVs.
The Verdict
Audi's reliability story is really two stories. The gas-powered sedans and compact SUVs (A4, A5, Q3) score in the low-to-mid 70s — solidly Good, competitive with non-luxury brands, and the best of any German manufacturer in our database. These models are reasonable choices for buyers who want German engineering without excessive reliability risk.
The larger SUVs (Q7, Q8) and first-generation EVs (E-Tron) tell a different story. Higher complexity, more recalls, more complaints, and significantly higher repair costs. The E-Tron's average score of 51.0 places it in Mixed territory — a genuine reliability risk, especially for used buyers outside of warranty.
If you're considering an Audi, the data points to three practical guidelines:
- Stick to 2022 or newer — reliability scores improve markedly in recent model years
- Smaller is more reliable — the A4, A5, and Q3 consistently outperform larger, more complex models
- Be cautious with first-gen EVs — the E-Tron's recall and complaint history is significantly worse than Audi's gas models
Browse the full reliability data for every Audi model on our Audi brand page.
Methodology
Every vehicle is scored 0–100 using four weighted factors: complaint severity normalized by sales volume (35%), independent repair cost data (30%), recall impact weighted by severity (20%), and issue diversity across complaint categories (15%). Scores are recalculated as new data becomes available. See our About page for full methodology details.
Scores represent the data as of the last update. Individual model scores change as new recalls and complaints are filed with NHTSA.