Last updated: 2026-10-10
Land Rover Reliability Ratings — Every Model Ranked
Mixed is the fairest verdict, and it sits well below average next to other brands on the site. Only two models are tracked, and they land one step apart. The Defender 110 holds up best, with good reliability, 23 recalls and 187 owner complaints. The Range Rover Sport trails with mixed reliability, 177 recalls and 757 complaints.
The same trouble shows up across both. Electrical faults lead the complaints, and some end in a stall or full loss of power, including a failed DC/DC converter. Windshields crack with no impact. Coolant leaks from turbo lines or pipes can push the temperature gauge toward red. For a shopper, the 2024 model year is the one to favor on both models. Expect costly out-of-warranty repairs and long waits for parts.
Land Rover Best Year Score Comparison
Each bar shows the best single model year score for that Land Rover model. Longer bars indicate higher peak reliability.
Land Rover Model Rankings
Scores below are averaged across all tracked model years. The “Best Year” column shows the highest-scoring model year that has been on the road for at least two years, where available.
| # | Vehicle | Best Year | Score | Rating | Recalls | Complaints / 10k | Maint. Rating |
|---|---|---|---|---|---|---|---|
| 1 | Land Rover Defender 110 | 2024 | 60/100 | Good | 23 | 20.7 | 2 |
| 2 | Land Rover Range Rover Sport | 2024 | 57/100 | Mixed | 177 | 56.4 | — |
Land Rover Models
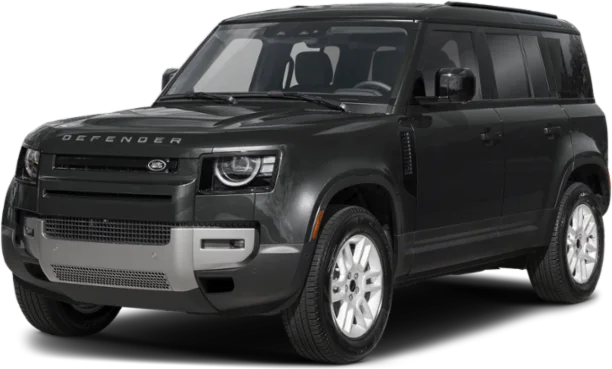
Electrical faults and cracking windshields are what to watch on this full-size SUV. The 2024 model year is the one to favor, with far fewer owner complaints than 2022 or 2023.

Mixed overall and well below average among sedans on the site. Screens freeze or go black and take climate and backup camera controls with them, and coolant pipes near the supercharger can split and overheat the engine.
Common Land Rover Problems
Top complaint categories across all Land Rover models, based on owner-reported issues to NHTSA.
Land Rover by Category
Frequently Asked Questions
- What is the most reliable Land Rover model?
- The Defender 110 is the most reliable Land Rover on the site, with good reliability. The 2024 model year is the one to favor, since it drew far fewer owner complaints than 2022 or 2023. The 2025 and 2026 cars are too new to judge, so their short complaint history does not make them better.
- Which Land Rover should I avoid?
- The Range Rover Sport is the weaker of the two, with mixed reliability and the most recalls and complaints. Be wary of the 2018 and 2020 model years, which draw the most serious complaints. If you want one, the 2024 model year is the better pick.
- Are Land Rovers expensive to repair?
- Owner complaints point that way, though the data here gives no brand repair-cost figure. One owner says the dealer replaced an entire headlamp assembly for thousands of dollars after the factory warranty expired. Another was told they would pay for a coolant leak repair. Check warranty status before you buy.
- Why do some Land Rovers stall while driving?
- Owners tie sudden stalls to electrical and power train faults. Some reports describe a low-battery warning, then a stall. Others describe a DC/DC converter failure, which was a diagnosed cause, with repairs taking weeks. Auto stop/start is also named, with engines dying at a light and stalling again when the driver pulls away.
- Do Land Rover windshields really crack on their own?
- Yes, owners report it often, mainly on the Defender 110. Windshields pop and crack while parked, overnight or at highway speed, with no impact. Some owners link it to extreme heat or cold. Replacement glass is often back ordered for months, and some owners say Land Rover denies responsibility.
Compare Land Rover vs Other Makes

Land Rover vs Acura
Compare reliability →

Land Rover vs Audi
Compare reliability →

Land Rover vs BMW
Compare reliability →

Land Rover vs Cadillac
Compare reliability →

Land Rover vs Dodge
Compare reliability →

Land Rover vs Ford
Compare reliability →

Land Rover vs GMC
Compare reliability →

Land Rover vs Honda
Compare reliability →

Land Rover vs Hyundai
Compare reliability →

Land Rover vs Infiniti
Compare reliability →

Land Rover vs Jeep
Compare reliability →

Land Rover vs Kia
Compare reliability →

Land Rover vs Lexus
Compare reliability →

Land Rover vs Lincoln
Compare reliability →

Land Rover vs Mazda
Compare reliability →

Land Rover vs Mercedes-Benz
Compare reliability →

Land Rover vs Nissan
Compare reliability →

Land Rover vs Porsche
Compare reliability →

Land Rover vs Ram
Compare reliability →

Land Rover vs Rivian
Compare reliability →

Land Rover vs Subaru
Compare reliability →

Land Rover vs Tesla
Compare reliability →

Land Rover vs Toyota
Compare reliability →

Land Rover vs Volkswagen
Compare reliability →

Land Rover vs Volvo
Compare reliability →
Most Reliable Used SUVs
View rankings →
Most Reliable Used Sedans
View rankings →
Best Land Rover Years
View rankings →
How we score Land Rover models
Scores weight complaint severity at 35%, repair costs at 30%, recall impact at 20%, and the spread of complaints across systems at 15%, with complaint counts adjusted for US sales. Read the full methodology.
See incorrect data? Report an issue