Most car buyers start with the same shortlist. The best-selling models dominate search results, dealer lots, and Reddit recommendations. But when we scored every vehicle in our database on a 0-100 reliability scale, the pattern was striking: the cars America buys the most are not the cars that break the least.
The fleet average across all vehicles we track is 70.2. Several of the highest-volume sellers fall well below that line. Meanwhile, vehicles that rarely make anyone's shortlist routinely score in the 80s and 90s.
We plotted every model in our database to see the full picture. Each dot below represents a used car model. The X-axis shows sales popularity (most recent full-year sales, normalized to percentile). The Y-axis shows our reliability score based on NHTSA recall records, owner-filed complaints, and independent repair cost data, all normalized by sales volume.
This chart shows 198 vehicle models. The most reliable are Lexus RX (90/100), Mazda CX-5 (87/100), Honda HR-V (86/100). The most popular by sales are GMC Canyon, Hyundai Ioniq 6, KIA Carnival.
The Four Quadrants
The dashed lines mark the fleet median for each axis. Every vehicle falls into one of four quadrants:
Safe Bets (top-right) — High popularity, high reliability. The internet is right about these. They sell well because they are reliable, and the data confirms it.
Hidden Gems (top-left) — Low popularity, high reliability. These vehicles score well above average but fly under the radar. Buyers fixated on the usual suspects are missing out.
Overrated (bottom-right) — High popularity, low reliability. This is the headline. Some of America's most-wanted used cars are among the least reliable options on the market. Demand driven by brand loyalty, marketing, and hype rather than engineering quality.
Forgotten (bottom-left) — Low popularity, low reliability. These vehicles have both weaker sales and below-median reliability scores. Some are troubled new launches; others are niche models that never found an audience.
Safe Bets: Popular and Reliable
These vehicles earn their sales volume. High demand, high scores, no gap between reputation and data.
KIA Carnival
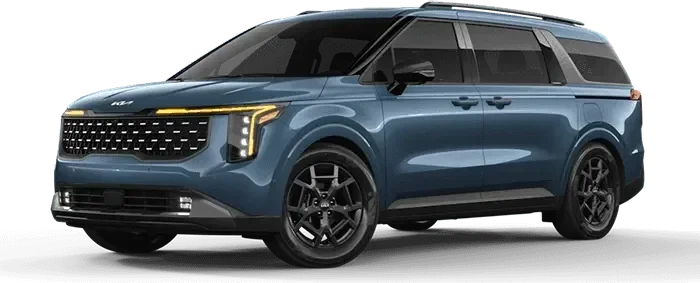
The KIA Carnival averages 82.5, placing it in Excellent territory. A Korean minivan outselling and outscoring most of its competitors is not the result most buyers expect. The Carnival benefits from a proven platform and Kia's dramatic quality improvement over the past decade. The brand average of 72.8 backs it up. If you're looking for a reliable family hauler, the data says Carnival.
Chevrolet Silverado

The Chevrolet Silverado averages 73.2 — Good. It's one of the best-selling vehicles in the country, and unlike many high-volume sellers, it earns that position with above-median reliability. The Silverado sits firmly in the top-right of the chart. If you want a reliable used truck with strong resale, the Silverado delivers.
Hidden Gems: Reliable but Overlooked
These vehicles score above the fleet median on reliability but sell below it. They're not on most buyers' radar — and that's a mistake.
Lexus UX
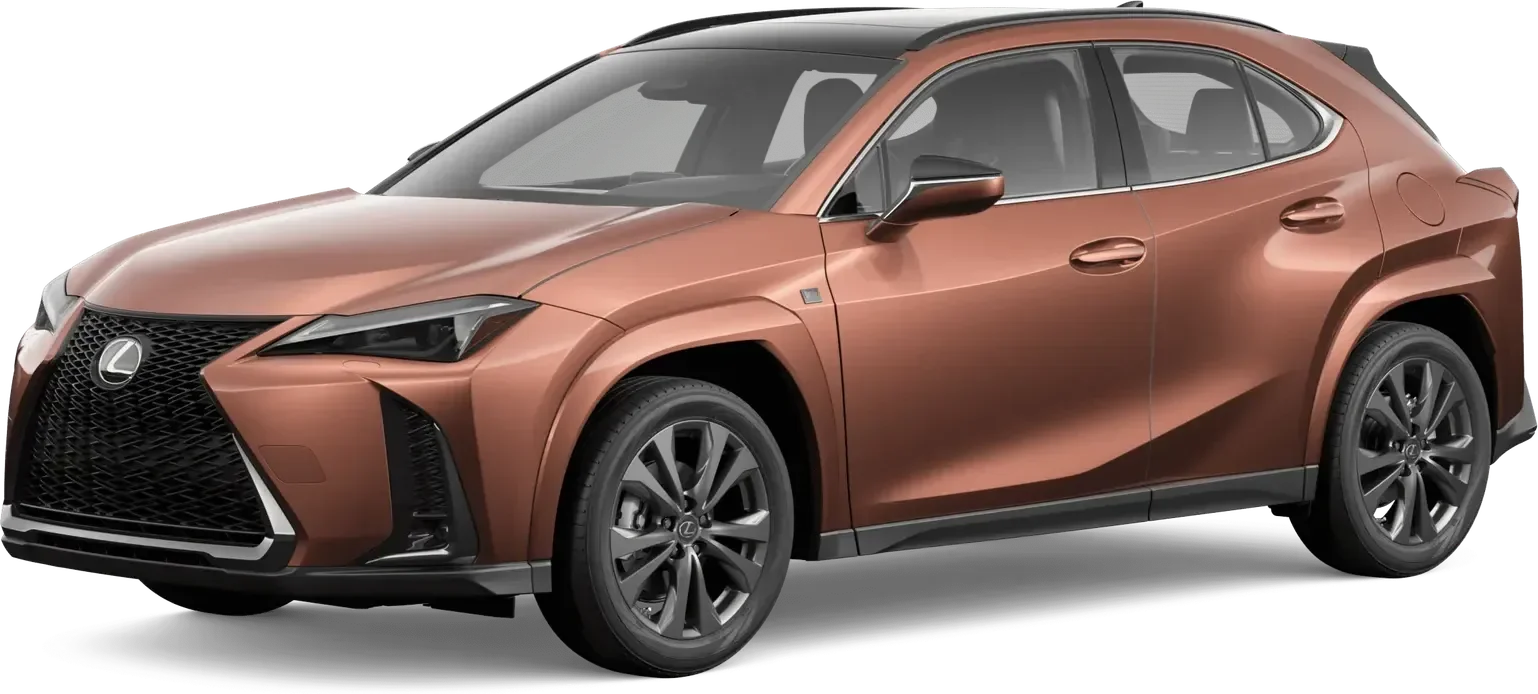
The Lexus UX averages 80.3, a Excellent result. It's the highest-scoring vehicle in the Hidden Gems quadrant and one of the top scores in our entire database. The UX is a subcompact luxury crossover — small, simple by Lexus standards, and built on Toyota's proven TNGA platform. Its sales are tiny compared to the RAV4 or CR-V, but the reliability data is outstanding. Lexus's brand average of 81.8 is among the best we track.
Toyota Crown
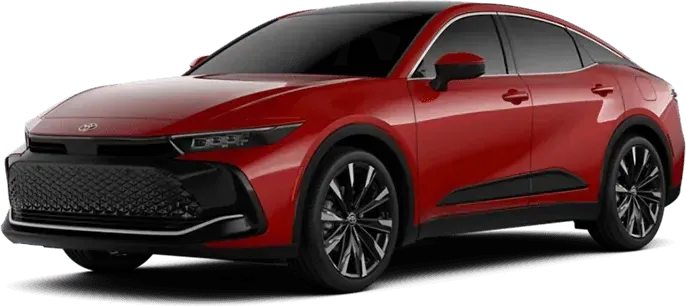
The Toyota Crown averages 85.0 — Excellent. Most American buyers have never heard of it. The Crown replaced the Avalon as Toyota's flagship sedan, but its unconventional styling and limited marketing left it flying under the radar. The reliability data doesn't care about brand awareness — the Crown scores well above the fleet median with low complaint rates across the board. A textbook Hidden Gem.
Overrated: Popular but Unreliable
These vehicles sell in high volume but score below the fleet median on reliability. The gap between demand and data is the story.
Tesla Model Y
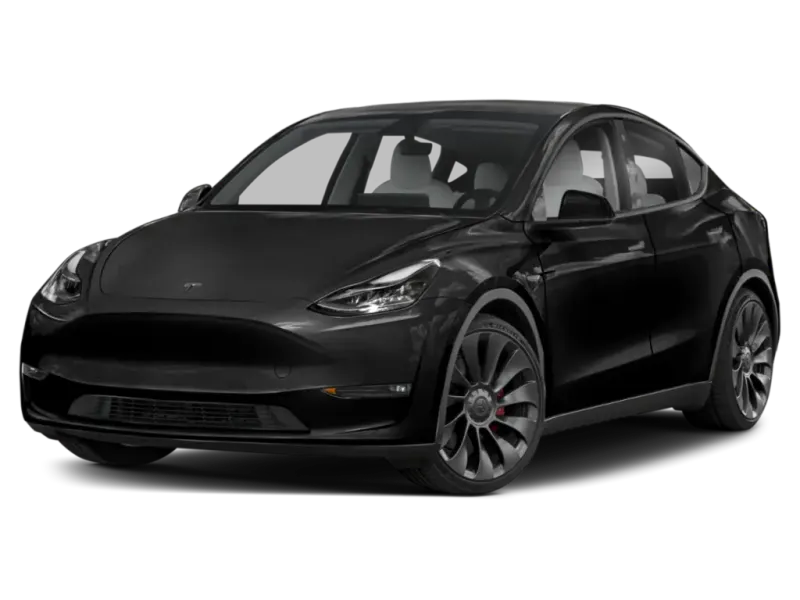
The Tesla Model Y averages 54.7, a Mixed result despite being one of the best-selling vehicles in America. Forward collision avoidance and steering complaints dominate NHTSA filings. Tesla's brand average of 52.2 is the lowest of any manufacturer we track. We covered this in depth in 10 Best-Selling Cars That Aren't Actually Reliable and The Most Overrated and Underrated Cars.
Ford Bronco
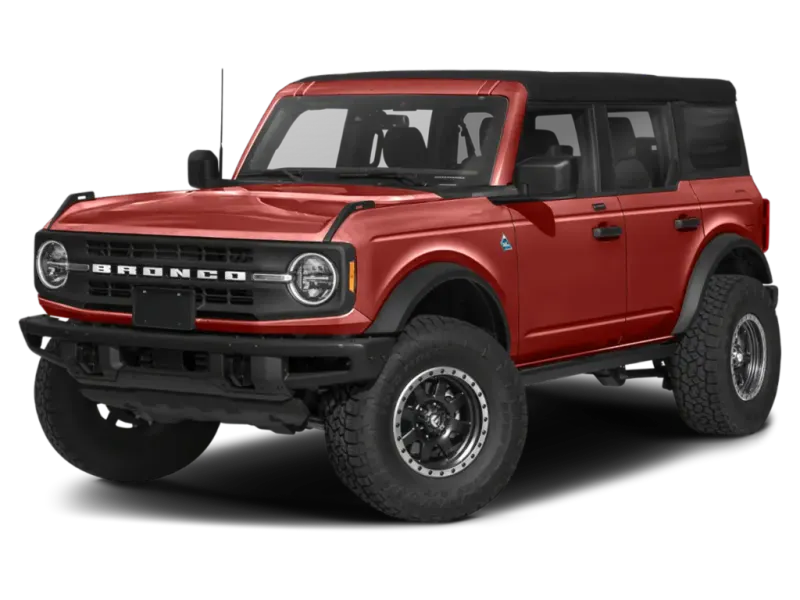
The Ford Bronco averages 52.0 — Mixed. The Bronco launched to massive hype, sold-out reservations, and dealer markups. But the reliability data hasn't matched the enthusiasm. First-generation growing pains, including electrical and powertrain complaints, pull its score well below the fleet median. High demand doesn't mean high quality — the Bronco is the textbook case.
Forgotten: Low Sales, Low Scores
These vehicles sit in the bottom-left: below-median reliability and below-median sales. Some are troubled new launches. Others are niche products that never gained traction.
Hyundai Ioniq 5
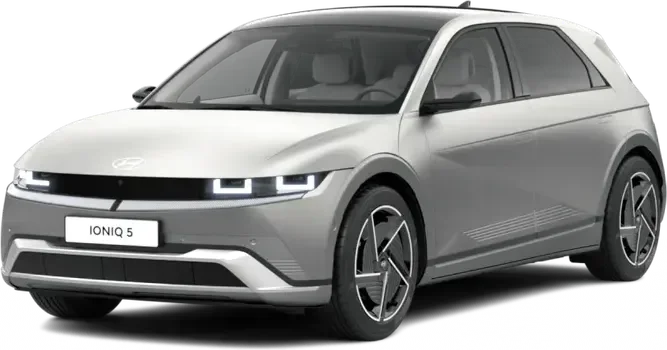
The Hyundai Ioniq 5 averages 54.0 — Mixed. It won awards, earned praise from reviewers, and became the poster child for affordable EVs. But the reliability data tells a different story. Electrical system and drivetrain complaints have pushed its score below the fleet median, and its sales volume — while growing — remains modest. A promising platform that the early data hasn't validated yet.
Ford F-150 Lightning
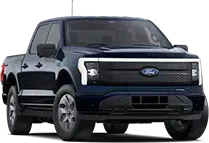
The Ford F-150 Lightning averages 54.2 — Mixed. Ford bet big on electrifying America's best-selling truck. But the Lightning's reliability score sits well below both the fleet median and the gas-powered F-150 (avg 67.7). Battery, electrical, and drivetrain complaints dominate the NHTSA filings. First-generation EV growing pains are real — and the Lightning is Exhibit A.
What the Scatter Plot Reveals
Beyond individual vehicles, three patterns emerge from the full distribution:
Japanese brands cluster in the top half. Toyota, Honda, Lexus, and Mazda models are disproportionately represented above the reliability median. Toyota's brand average is 75.6, Honda's is 74.1, Lexus is 81.8. This isn't one standout model carrying the brand — it's consistent performance across the lineup.
Complexity correlates with lower scores. The vehicles in the bottom half of the chart tend to be larger, more feature-laden, or built on newer platforms. Turbocharged powertrains, advanced electronics, and first-generation designs generate more complaints per unit sold. The simplest vehicles — subcompact SUVs, proven sedans, long-running platforms — cluster at the top.
The Forgotten quadrant is dominated by new launches and EVs. The Ioniq 5, F-150 Lightning, Cybertruck, CX-90, and Rivian R1S all land in the bottom-left. New platforms need time to mature. Buyers treating first-model-year EVs as proven daily drivers are accepting more risk than the data supports.
The Verdict
The scatter plot makes one thing clear: popularity is not a proxy for reliability. The vehicles most buyers default to — the ones that dominate dealer lots and search results — score below the fleet average more often than above it.
For used car buyers, the actionable insight is in the top-left quadrant. The Hidden Gems are vehicles with strong reliability data and low demand, which often means lower prices and less competition. The Lexus UX, Toyota Crown, Honda Ridgeline, and Subaru Crosstrek all score above the fleet median while selling below it.
If you're shopping by category, see our rankings for the most reliable used SUVs, sedans, and trucks. For the full methodology behind these scores, see our About page.
The chart updates automatically as new recalls and complaints are filed with NHTSA. Explore any dot to see the full reliability breakdown for that vehicle.
Methodology
Reliability scores are calculated on a 0-100 scale using four weighted factors: complaint severity normalized by sales volume (35%), independent repair cost ratings (30%), recall impact weighted by severity (20%), and issue diversity across complaint categories (15%). Scores of 80+ are excellent, 60-79 good, 40-59 mixed, and below 40 poor.
Sales popularity uses the most recent complete year of U.S. sales data available for each model, normalized to percentile rank so the distribution is even across the X-axis.
Scores update automatically as new complaints and recalls are filed with NHTSA. The data in this article reflects the latest available information at the time of your visit.
Source: NHTSA recalls and complaints, independent repair cost data, U.S. sales figures. Data from autoreliabilityindex.com.