
Americans buy millions of vehicles every year based on brand loyalty, dealership recommendations, and what their neighbors drive. But best-selling doesn't mean best-built.
We scored over 80 vehicles on a 0-100 reliability scale using four weighted factors: complaint severity normalized by sales volume, independent repair cost data, recall impact weighted by severity, and issue diversity across complaint categories. The fleet average sits at 70.2. Every score on this page updates automatically as new complaint and recall data is filed with NHTSA.
These are 10 of America's most popular vehicles that score well below what their sales numbers would suggest. Five of them average below 55 out of 100. All of them have more reliable alternatives in the same segment.
At a Glance
| Vehicle | Perceived Reliability | ARI Score | ARI Tier | Verdict |
|---|---|---|---|---|
| Ford Bronco | High | 52.0 | Mixed | Overrated |
| Volkswagen Atlas | High | 53.8 | Mixed | Overrated |
| Tesla Model Y | High | 54.7 | Mixed | Overrated |
| Tesla Model 3 | High | 54.7 | Mixed | Overrated |
| Mercedes-Benz C-Class | High | 55.3 | Mixed | Overrated |
| BMW X5 | High | 59.2 | Mixed | Overrated |
| Jeep Wrangler | High | 63.2 | Good | Overrated |
| Honda Odyssey | High | 65.6 | Good | Overrated |
| Jeep Grand Cherokee | High | 66.4 | Good | Overrated |
| Ford Explorer | High | 66.7 | Good | Overrated |
Mixed Territory: The Biggest Gaps Between Popularity and Reliability
These vehicles score well below the fleet average, landing in mixed or poor territory despite strong sales and enthusiastic buyer communities.
Ford Bronco
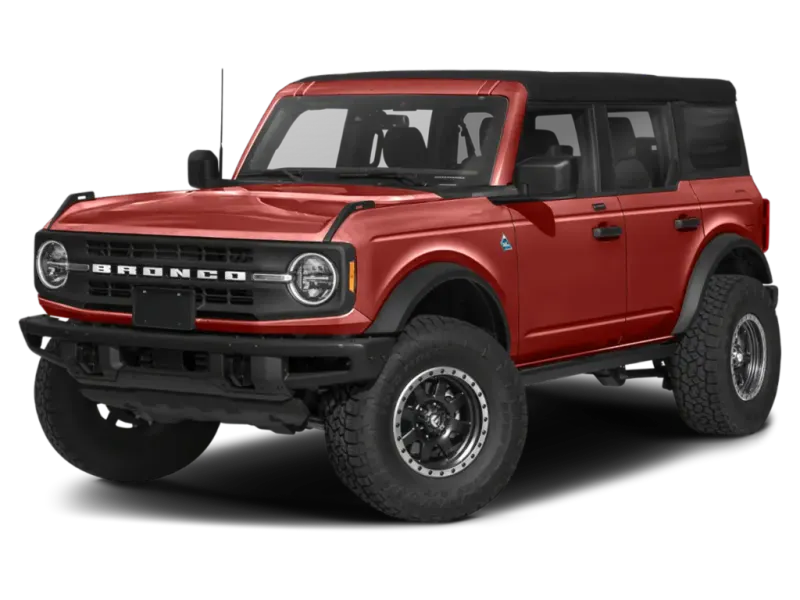
Ford revived the Bronco in 2021 to enormous hype. Reservations sold out. Dealerships added markups. The off-road community embraced it as the Wrangler killer. The reliability data hasn't followed the enthusiasm.
The Bronco averages 52.0, placing it in Mixed territory. Electrical system and powertrain complaints dominate the filings, with early model years generating some of the highest complaint rates in our database. The 2021 model year alone accumulated nearly 800 NHTSA complaints, with 15 fire reports and 19 injury reports.
Recent model years show improvement — scores have climbed from the low 40s to the low 60s — but the model average reflects a vehicle that launched with significant quality issues. See which Bronco years to avoid.
Consider the Toyota 4Runner instead, which averages 80.3 — a proven off-road platform with decades of reliability data behind it.
Volkswagen Atlas
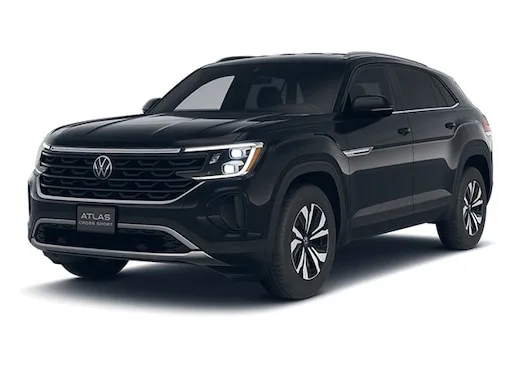
The Atlas is Volkswagen's answer to the American three-row SUV market. It sells steadily — over 572,000 units since launch — carried by the "German engineering" reputation and competitive pricing. The reliability data tells a different story.
The Atlas averages 53.8, a Mixed result. Electrical system complaints are the dominant theme across every model year, with airbag-related filings consistently among the top complaint categories. The 2021 model year stands out with 540 complaints, including 180 electrical system filings alone.
The Atlas competes against vehicles that significantly outscore it. See which Atlas years to avoid.
Consider the Honda Passport instead, which averages 73.6 — a midsize SUV that trades the third row for substantially better reliability.
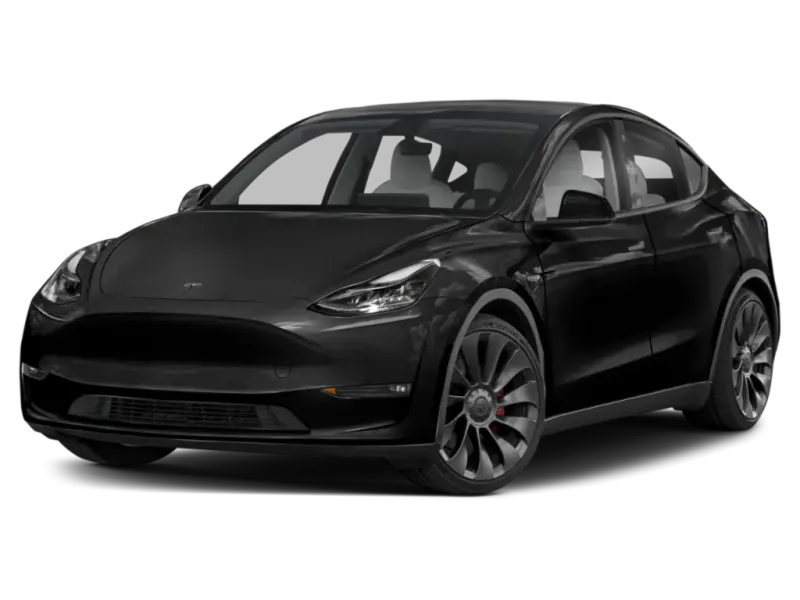
Tesla Model Y

The Model Y became the best-selling vehicle globally. Over 1.4 million sold. Tesla's brand carries an aura of technological superiority that makes buyers assume the engineering extends to build quality. The NHTSA data paints a different picture.
The Model Y averages 54.7, placing it in Mixed territory. Forward collision avoidance complaints lead every model year — a pattern unique to Tesla in our database. Vehicle speed control and steering complaints follow. The 2022 model year recorded 136 injury reports, one of the highest single-year injury counts across all vehicles we track.
Tesla's brand average of 52.2 is the lowest of any manufacturer in our database. Recent model years show improvement, but the overall average reflects a pattern of high complaint rates. See which Model Y years to avoid.
Consider the Toyota RAV4 instead, which averages 76.1 — including hybrid and plug-in hybrid variants that offer electrification without the reliability concerns.
Tesla Model 3
The Model 3 pioneered affordable electric vehicles and sold over 1.4 million units. It shares many of the same reliability patterns as its larger sibling.
The Model 3 averages 54.7, also in Mixed territory. Forward collision avoidance and vehicle speed control complaints dominate the filings, with electrical system, suspension, and steering complaints rounding out the top categories. The 2018 launch year generated 951 complaints — understandable for a new platform, but the elevated complaint rates persisted for years afterward.
Later model years show meaningful improvement, with scores climbing into the mid-60s. But the model average reflects years of accumulated complaints. See which Model 3 years to avoid.
Consider the Honda Civic instead, which averages 78.2 — a sedan with decades of proven reliability and significantly lower complaint rates.
Mercedes-Benz C-Class
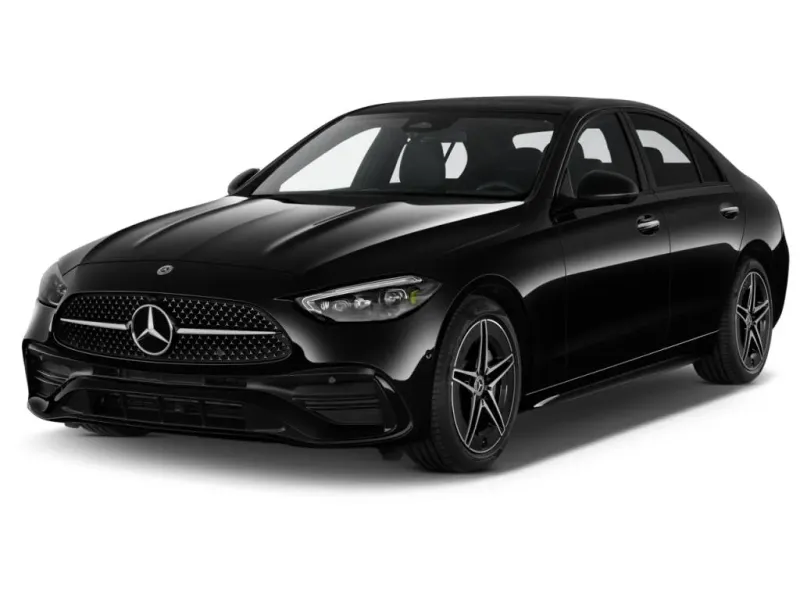
The C-Class is Mercedes' best-selling sedan worldwide, with over 1.2 million units sold. The three-pointed star carries an expectation of engineering excellence. The reliability data doesn't support that assumption.
The C-Class averages 55.3, placing it in the Mixed range. What stands out isn't just the complaints — it's the recalls. The 2020 model year accumulated 170 recalls, and every year from 2018 to 2023 had over 80. Electrical system and engine complaints lead the filings, with fire reports appearing in most model years.
The Mercedes-Benz brand average sits at 60.0, well below the fleet average. Premium pricing doesn't translate to premium reliability. See which C-Class years to avoid.
Consider the Toyota Camry instead, which averages 78.0 — and costs significantly less to maintain.
BMW X5
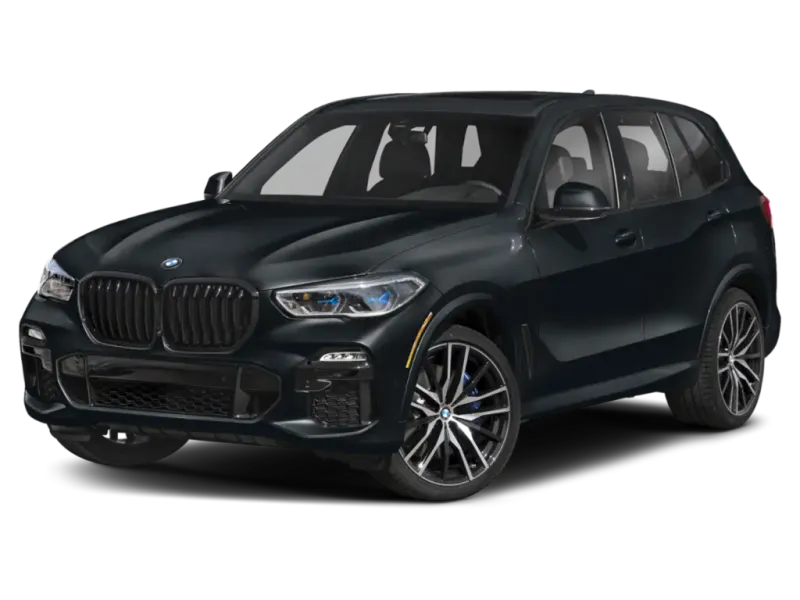
The X5 established the luxury SUV segment and continues to sell over a million units. BMW's "Ultimate Driving Machine" positioning leads buyers to expect premium reliability from a premium price tag.
The X5 averages 59.2, firmly in Mixed territory. Electrical system and powertrain complaints are the primary drivers across most model years. The 2024 model year saw a spike in brake-related complaints, with 46 filings for hydraulic brake issues alone. BMW's complex electronics, multi-mode suspension systems, and turbocharged powertrains create more potential failure points than simpler competitors.
The BMW brand average of 65.7 sits below the fleet average. See which X5 years to avoid.
Consider the Lexus RX instead, which averages 86.3 — the highest-scoring luxury SUV in our database.
Good on Paper, Disappointing in Practice
These vehicles score in the lower end of the "Good" range. They aren't unreliable in absolute terms, but they underperform relative to their enormous sales volumes and brand reputations.
Jeep Wrangler
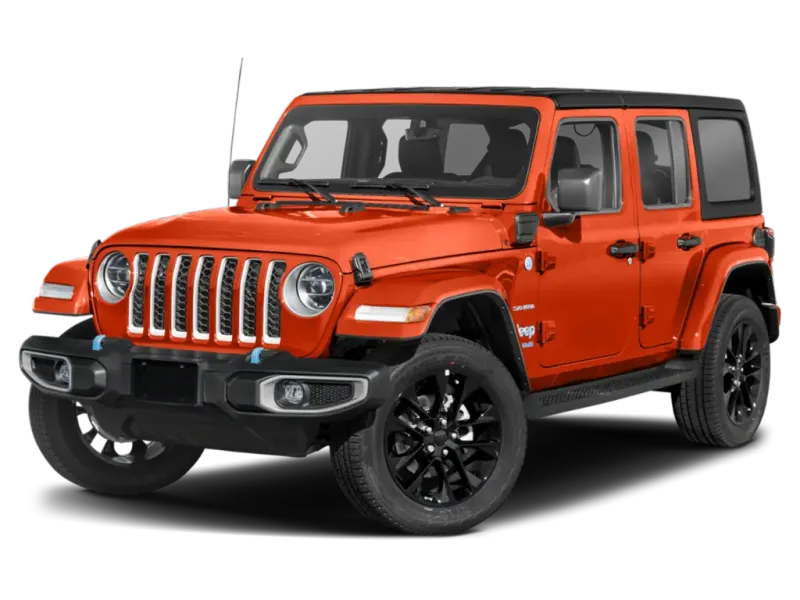
The Wrangler has a devoted following. Over 3.3 million units sold. Off-road forums celebrate it. Owners form clubs around it. The reliability data suggests that devotion requires tolerance.
The Wrangler averages 63.2, a Good result that understates the severity of its worst years. The 2018 model year alone generated 1,750 complaints — including 1,100 steering complaints, 24 fire reports, and 13 injury reports. Steering issues remain a recurring theme across multiple years. Electrical system complaints appear consistently in the top categories.
Recent model years show improvement, but the Wrangler's historical pattern of high complaint volumes persists. See which Wrangler years to avoid.
Consider the Toyota 4Runner instead, which averages 80.3 — an off-road-capable SUV that doesn't ask you to accept reliability compromises as part of the ownership experience.
Honda Odyssey
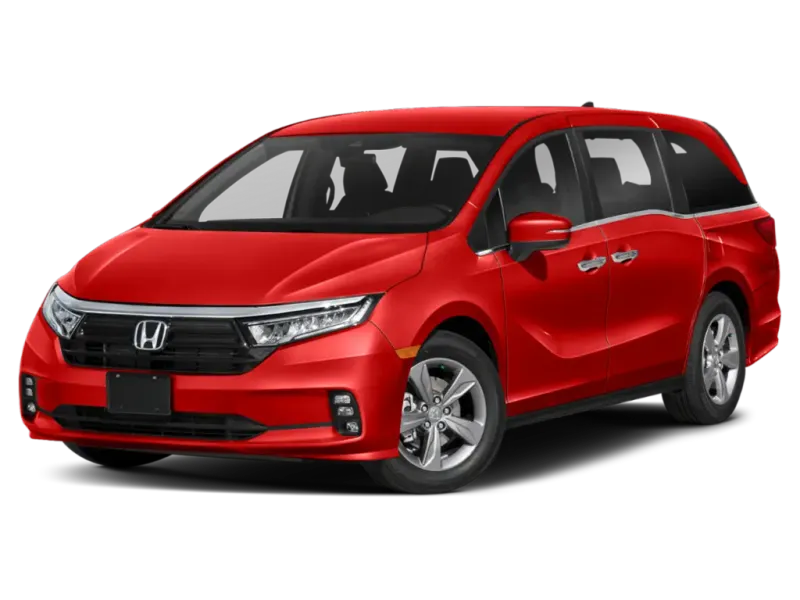
Honda's reliability reputation is well-earned across most of its lineup. The Odyssey is the exception. Over 2.3 million units sold, largely on the strength of the Honda badge. Minivan buyers tend to prioritize dependability above all else — which makes the Odyssey's data noteworthy.
The Odyssey averages 65.6, placing it in the Good range but well below Honda's brand average of 74.1. Electrical system complaints lead every model year. Powertrain and forward collision avoidance complaints are the other consistent themes. The 2018 and 2019 model years each generated over 750 complaints.
The Odyssey has improved meaningfully in recent years, with scores climbing into the low 70s. But the minivan segment is tight — even the best alternative doesn't score dramatically higher. See which Odyssey years to avoid.
Consider the Toyota Sienna instead, which averages 73.7 — a modest improvement, but one that comes with Toyota's stronger track record in the category.
Jeep Grand Cherokee
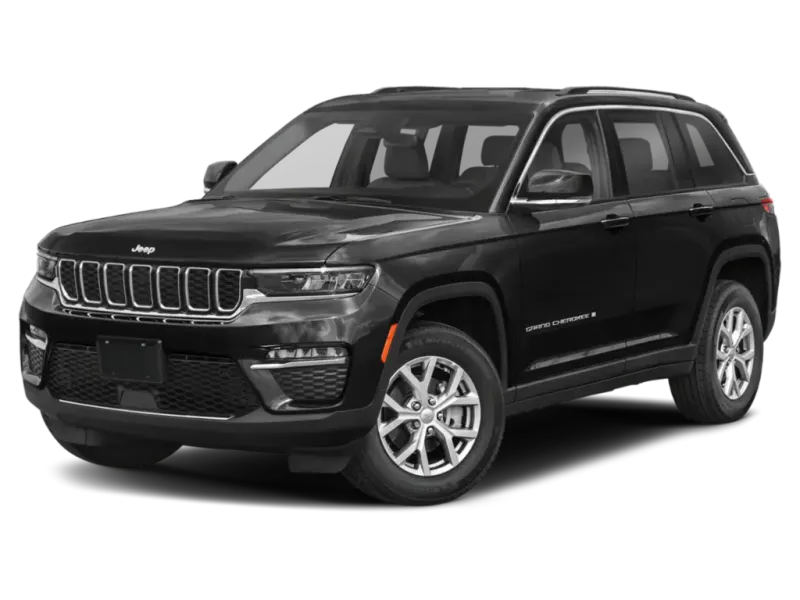
The Grand Cherokee is one of America's best-selling SUVs, with over 3.8 million units sold. It's the mainstream Jeep — the one people buy for daily driving rather than trail running. The reliability data shows a vehicle that's acceptable but disappointing for its volume.
The Grand Cherokee averages 66.4, a Good result. Electrical system complaints dominate across every model year. Steering issues spike in 2021-2023, and powertrain complaints appear consistently. The recall count is also notable — the 2023 model year alone had 22 recalls.
The Grand Cherokee's scores have trended upward in recent years, but the model average reflects years of elevated complaint rates. See which Grand Cherokee years to avoid.
Consider the Mazda CX-5 instead, which averages 82.6 — a smaller SUV, but one that consistently scores among the most reliable vehicles in our database.
Ford Explorer
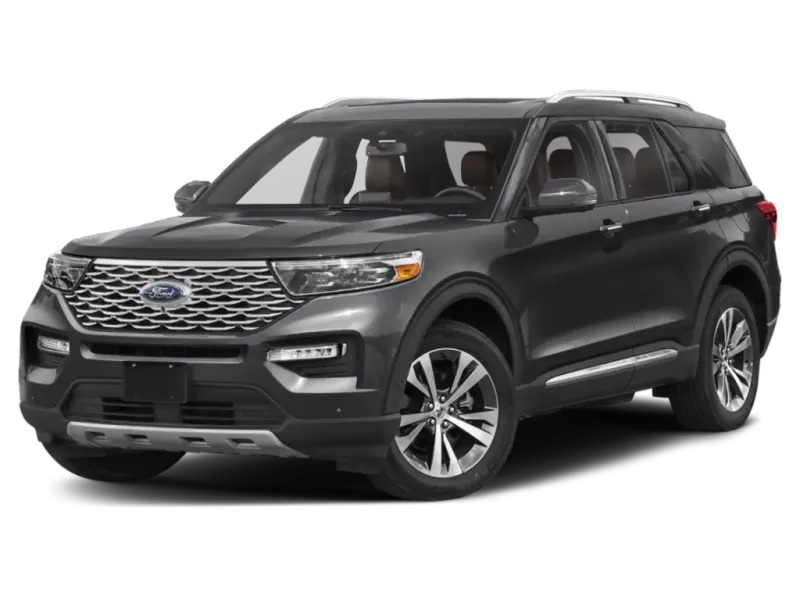
The Explorer is America's best-selling SUV, with nearly 4 million units sold. It's the default family hauler, the fleet vehicle, the three-row that parents choose because it feels like the safe, sensible option. The 2020 redesign complicated that narrative.
The Explorer averages 66.7, placing it in Good territory. The 2020 model year — a full redesign — is the clear outlier with 1,066 complaints, 390 of which were powertrain-related. That single year generated 29 recalls, 11 fire reports, and 36 injury reports. The redesign introduced a rear-wheel-drive platform that brought new failure modes buyers weren't expecting from a vehicle they trusted.
Pre-2020 and post-2022 model years score better, but the model average carries the weight of that troubled redesign. See which Explorer years to avoid.
Consider the Toyota Highlander instead, which averages 73.0 — a modest improvement in score, but a meaningful one in consistency across model years.
What These Cars Have in Common
Three patterns emerge from this list.
First, SUVs dominate. Eight of the ten vehicles are SUVs or crossovers. The segment combines high complexity (advanced electronics, all-wheel-drive systems, towing packages) with high volume, creating more opportunities for complaints per model. Simpler vehicles — sedans, compacts, trucks with basic powertrains — consistently score higher in our database.
Second, first model years after major redesigns are where reliability suffers most. The Ford Explorer's 2020 redesign, the Ford Bronco's 2021 launch, the Volkswagen Atlas's 2018 debut — each represents a new platform working through early production issues. Buyers who wait two to three years after a redesign typically see significantly better reliability scores.
Third, brand reputation masks reliability problems. Tesla's tech prestige, BMW's engineering heritage, Jeep's rugged authenticity, and Honda's dependability legacy all create expectations that the complaint data doesn't support for these specific models. The numbers don't have brand loyalty.
If you're shopping for a reliable used vehicle, see our full rankings for the most reliable used SUVs and the most reliable used sedans.
The Verdict
Popularity is a measure of marketing, pricing, and dealership availability. It's not a measure of reliability. The ten vehicles on this list have sold tens of millions of units between them, and every one of them scores below the fleet average of 70.2.
That doesn't mean these are bad vehicles. Several — particularly the Honda Odyssey, Grand Cherokee, and Explorer — score in the "Good" range and have improved in recent model years. But buyers who assume that best-selling means best-built are making a decision based on incomplete information.
The most reliable vehicles in our database share common traits: proven platforms, simpler powertrains, fewer electronic systems, and manufacturers with consistent quality across their entire lineup. None of those traits correlate with sales volume.
Do your research, not your neighbor's recommendation. Check individual vehicle pages on our site to see year-by-year scores, complaint breakdowns, and which years to avoid before you buy. We also covered several of these vehicles in our analysis of the most overrated and underrated cars for reliability.
Methodology
Every vehicle is scored 0-100 using four weighted factors: complaint severity normalized by sales volume (35%), independent repair cost data (30%), recall impact weighted by severity (20%), and issue diversity across complaint categories (15%). Complaint counts are normalized by sales volume so popular vehicles aren't penalized by sheer scale — a vehicle with 10 million sales and 1,000 complaints is treated differently than one with 100,000 sales and the same number. See our About page for full methodology details.
Scores in the table and badges reflect model averages across all indexed years and update automatically as new recalls and complaints are filed with NHTSA.