Last updated: 2026-10-10
Ford Mustang vs Tesla Model 3: Reliability Compared
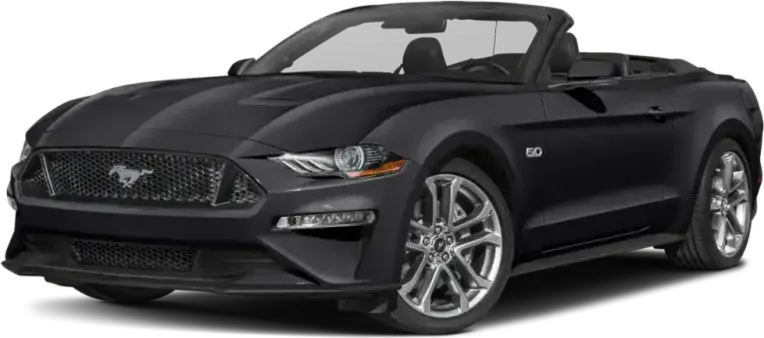
Ford Mustang
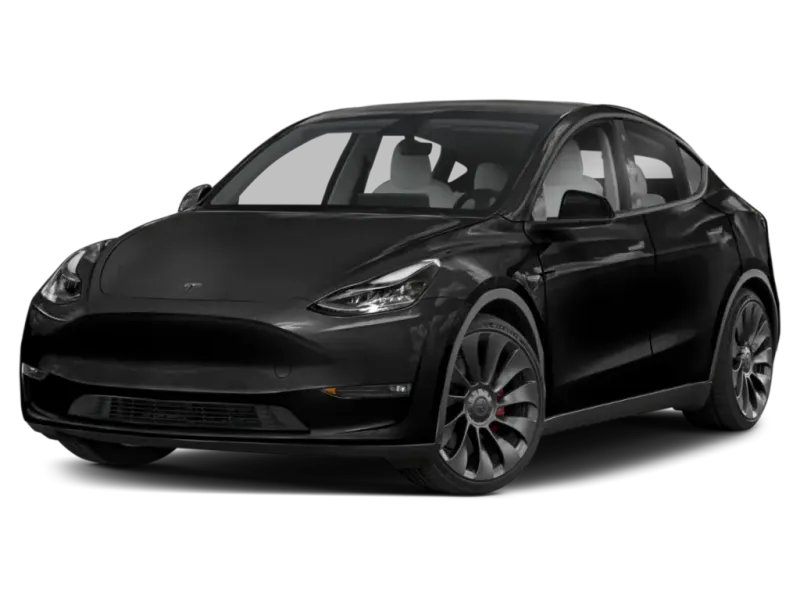
Tesla Model 3
On reliability, the Mustang comes out well ahead of the Tesla Model 3. Owners filed 5.7 complaints per 10,000 sold versus 28.7 for the Model 3. The Mustang's main risk is coolant leaking into cylinders on the 2.3L EcoBoost, while Model 3 reports center on phantom braking and sudden acceleration.
How Do the Ford Mustang and Tesla Model 3 Generations Compare?
Verdict
The Ford Mustang is more reliable than the Tesla Model 3, scoring 67/100 vs 55/100.
Reliability favors the Mustang by a large gap. Owners filed far fewer complaints per car sold, federal recall records show fewer recalls across the same nine model years, and its standing is good while the Model 3's is mixed. The Mustang's serious risk is narrower: coolant leaking into cylinders on the 2.3L EcoBoost. Problems on the Model 3 spread across braking, acceleration, steering, and electrical systems, and every one of those areas has crash-linked reports.
Key Differences
- 1Ford Mustang has 42 fewer total recalls
- 2Ford Mustang has 23.0 fewer complaints per 10k sold
- 3Ford Mustang scores 12 points higher in reliability
Category Scoreboard
Ford Mustang vs Tesla Model 3: Which Is More Reliable?
| Metric | Ford Mustang | Tesla Model 3 |
|---|---|---|
| Reliability Score | 67/100 | 55/100 |
| Years Tracked | 9 | 9 |
| Total Recalls | 71 | 113 |
| Complaints per 10k Sold | 5.7 | 28.7 |
| Year Wins | 9 | 0 |
What Are the Common Problems With the Ford Mustang and Tesla Model 3?
Safety systems fail most often on the Model 3. Phantom braking is the most common report, along with automatic emergency braking that ignores stopped cars. Sudden acceleration while parking dominates speed control complaints, and the Mustang has no matching category. Control arm wear, charging failure, and touchscreen blackouts add to the list. Trouble on the Mustang is mechanical and more contained: blank digital gauges, windows that drop on their own, a hard-shifting 10-speed automatic, and EcoBoost head gasket leaks. Its engine complaints have no crash-linked reports. The Model 3 has crash-linked reports in all five main problem areas.
| Component | Ford Mustang | Tesla Model 3 |
|---|---|---|
| FORWARD COLLISION AVOIDANCE | 0.3Very Low | 6.1Average |
| ELECTRICAL SYSTEM | 1.5Low | 3Low |
| VEHICLE SPEED CONTROL | 0.2Very Low | 3.7Average |
| UNKNOWN OR OTHER | 0.6Very Low | 3.1Average |
| STEERING | 0.2Very Low | 2.6Low |
| SERVICE BRAKES | 0.2Very Low | 2.1Low |
| AIR BAGS | 0.1Very Low | 1.7Low |
| SUSPENSION | —None | 1.6Low |
| POWER TRAIN | 0.9Very Low | 0.4Very Low |
| STRUCTURE | 0.2Very Low | 0.7Very Low |
| ENGINE | 0.4Very Low | —None |
| LANE DEPARTURE | —None | 0.3Very Low |
| EXTERIOR LIGHTING | —None | 0.2Very Low |
| ENGINE AND ENGINE COOLING | 0.1Very Low | —None |
| VISIBILITY | 0.1Very Low | —None |
| BACK OVER PREVENTION | 0.1Very Low | —None |
| LATCHES/LOCKS/LINKAGES | 0.1Very Low | —None |
| WHEELS | —None | 0.1Very Low |
| SEATS | —None | 0.1Very Low |
| FUEL/PROPULSION SYSTEM | —None | —None |
| FUEL SYSTEM | —None | —None |
| VISIBILITY/WIPER | —None | —None |
| SEAT BELTS | —None | —None |
Complaints per 10,000 units sold, aggregated across all tracked model years from NHTSA owner reports.
How Does Ford Mustang vs Tesla Model 3 Reliability Compare by Year?
| Year | Ford Mustang | Tesla Model 3 | Edge |
|---|---|---|---|
| 2026 | 78/1001R / 0C | 59/1001R / 1C | Ford Mustang |
| 2025 | 73/1003R / 8C | 67/1003R / 87C | Ford Mustang |
| 2024 | 67/10010R / 63C | 62/1004R / 183C | Ford Mustang |
| 2023 | 72/1006R / 14C | 57/10010R / 386C | Ford Mustang |
| 2022 | 59/10017R / 154C | 50/10016R / 729C | Ford Mustang |
| 2021 | 54/10018R / 373C | 48/10020R / 626C | Ford Mustang |
| 2020 | 66/1008R / 101C | 54/10020R / 416C | Ford Mustang |
| 2019 | 67/1004R / 129C | 49/10021R / 569C | Ford Mustang |
| 2018 | 65/1004R / 172C | 46/10018R / 951C | Ford Mustang |
Best years to cross-shop: The 2023 Ford Mustang scored 72/100 and the 2024 Tesla Model 3 scored 62/100 — the strongest shared model years that have been on the road for at least two years, where available.
Who Should Buy the Ford Mustang vs the Tesla Model 3?
Ford Mustang vs Tesla Model 3: Common Questions
- Is the Tesla Model 3 more reliable than the Ford Mustang?
- No. The Mustang is clearly more reliable. It has a good standing against the Model 3's mixed one, and owners filed 5.7 complaints per 10,000 sold versus 28.7. The Model 3 also has crash-linked reports in all five of its main problem areas.
- Which has more recalls, the Model 3 or the Mustang?
- The Model 3 has more. Federal recall records show 113 recalls across its nine model years from 2018 to 2026, against 71 for the Mustang. Recall counts do not show how serious each one was, so read the individual recall notices for any car you consider.
- What is the biggest problem with the Ford Mustang?
- The 2.3L EcoBoost engine can leak coolant into the cylinders. Signs include rough cold starts, shaking at idle, misfire codes, and falling coolant. Failures were reported from 26,000 to 86,000 miles, with dealer estimates near $11,000 for head gasket work or a full engine.
- Does the Tesla Model 3 have phantom braking problems?
- Yes. Phantom braking is the most common complaint in forward collision avoidance, with 841 complaints. Owners describe hard stops with nothing ahead, often near overpasses or at hill crests. Others report the opposite, where emergency braking fails to react to stopped cars. One hard stop caused whiplash.
- Which Model 3 and Mustang years should I avoid?
- Avoid the 2018 and 2021 Model 3, and the 2021 and 2022 Mustang. Those are the weakest years for each. Older Model 3 cars can have rusted brake lines and worn control arms, so inspect those closely on any used example.
Related Reliability Comparisons
More Ford Mustang comparisons
Decided between Ford Mustang and Tesla Model 3? Run a VIN check before you buy — uncover hidden accidents, title issues, and open recalls.
How we score the Ford Mustang and Tesla Model 3
Scores weight complaint severity at 35%, repair costs at 30%, recall impact at 20%, and the spread of complaints across systems at 15%, with complaint counts adjusted for US sales. Read the full methodology.
See incorrect data? Report an issue