Last updated: 2026-10-10
Ford Edge vs Toyota Highlander: Reliability Compared
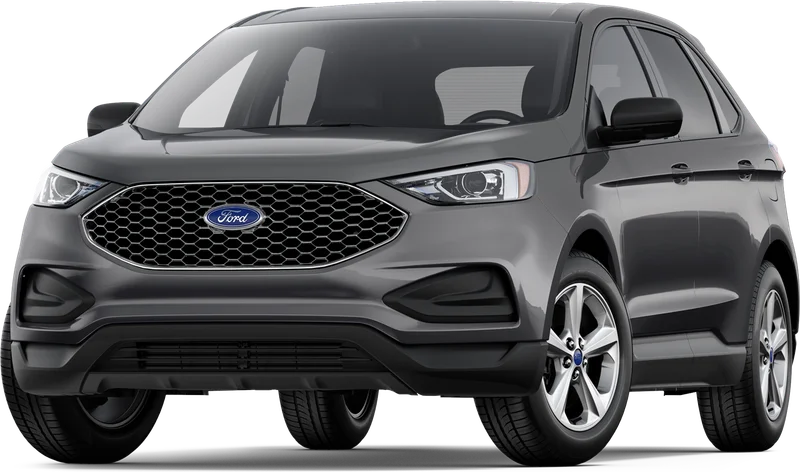
Ford Edge
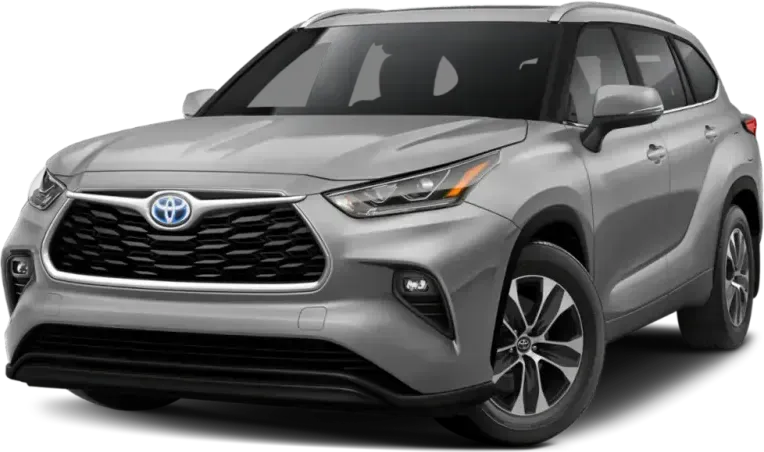
Toyota Highlander
Toyota Highlander beats the Ford Edge on reliability by a clear margin. Owners file fewer complaints per car sold, and the Edge's worst problem is coolant leaking into the engine, which often means a new engine. The Highlander has more recalls on record, though.
How Do the Ford Edge and Toyota Highlander Generations Compare?
Verdict
The Toyota Highlander is more reliable than the Ford Edge, scoring 73/100 vs 67/100.
Owners file noticeably fewer complaints per car sold on the Highlander, and that is the deciding reason it holds a clear edge. The Edge's complaints pile up around one expensive failure: coolant leaking into the cylinders of the 2.0L EcoBoost, often ending in a new engine quote as high as $12,000. The Highlander has serious problems too, including transmission failures and bumper cover detachments. Its trouble is spread across more systems and less concentrated in one engine defect. It also has more recalls on record, so check each VIN.
Key Differences
- 1Ford Edge has 34 fewer total recalls
- 2Toyota Highlander scores 6 points higher in reliability
- 3Toyota Highlander has 3.6 fewer complaints per 10k sold
Category Scoreboard
Ford Edge vs Toyota Highlander: Which Is More Reliable?
| Metric | Ford Edge | Toyota Highlander |
|---|---|---|
| Reliability Score | 67/100 | 73/100 |
| Years Tracked | 7 | 9 |
| Total Recalls | 32 | 66 |
| Complaints per 10k Sold | 9.4 | 5.8 |
| Safety RatingNHTSA overall | 2024 NHTSA | 2026 NHTSA |
| Frontal | ||
| Side | ||
| Rollover | ||
| Year Wins | 2 | 5 |
What Are the Common Problems With the Ford Edge and Toyota Highlander?
Coolant intrusion dominates the Edge's complaints. It brings misfires, white smoke, milky oil, and a long-block replacement, usually between about 50,000 and 100,000 miles. Dead batteries and a blank rearview camera, tied to a recall with parts delays, round out the list. Highlander complaints spread wider. A whining transmission ends in a replacement, brakes can surge forward at low speed, and the front bumper cover can detach at highway speed. Only the Highlander has air bag and service brake complaints with crash links, including 41 crash-linked air bag reports, many describing no deployment in front impacts.
| Component | Ford Edge | Toyota Highlander |
|---|---|---|
| POWER TRAIN | 3.3Average | 1.5Low |
| ENGINE | 2Low | 0.2Very Low |
| UNKNOWN OR OTHER | 0.6Very Low | 0.8Very Low |
| ENGINE AND ENGINE COOLING | 0.9Very Low | —None |
| ELECTRICAL SYSTEM | 0.5Very Low | 0.4Very Low |
| STRUCTURE | 0.2Very Low | 0.5Very Low |
| SERVICE BRAKES | 0.1Very Low | 0.5Very Low |
| AIR BAGS | 0.1Very Low | 0.5Very Low |
| FUEL/PROPULSION SYSTEM | 0.1Very Low | 0.3Very Low |
| BACK OVER PREVENTION | 0.3Very Low | —None |
| WHEELS | 0.1Very Low | —None |
| SEAT BELTS | 0.1Very Low | —None |
| VISIBILITY | 0.1Very Low | —None |
| EXTERIOR LIGHTING | 0.1Very Low | —None |
| VEHICLE SPEED CONTROL | —None | 0.1Very Low |
| STEERING | —None | 0.1Very Low |
| FUEL SYSTEM | —None | 0.1Very Low |
| FORWARD COLLISION AVOIDANCE | —None | —None |
| SEATS | —None | —None |
| SUSPENSION | —None | —None |
| LATCHES/LOCKS/LINKAGES | —None | —None |
| LANE DEPARTURE | —None | —None |
| VISIBILITY/WIPER | —None | —None |
| TIRES | —None | —None |
Complaints per 10,000 units sold, aggregated across all tracked model years from NHTSA owner reports.
How Does Ford Edge vs Toyota Highlander Reliability Compare by Year?
| Year | Ford Edge | Toyota Highlander | Edge |
|---|---|---|---|
| 2024 | 76/1002R / 38C | 67/10016R / 198C | Ford Edge |
| 2023 | 74/1004R / 16C | 73/10013R / 140C | Ford Edge |
| 2022 | 69/1005R / 113C | 74/1007R / 186C | Toyota Highlander |
| 2021 | 69/1007R / 92C | 70/1006R / 403C | Toyota Highlander |
| 2020 | 64/1004R / 272C | 71/1008R / 269C | Toyota Highlander |
| 2019 | 60/1003R / 687C | 70/1003R / 414C | Toyota Highlander |
| 2018 | 57/1007R / 746C | 72/1005R / 242C | Toyota Highlander |
Best years to cross-shop: The 2024 Ford Edge scored 76/100 and the 2022 Toyota Highlander scored 74/100 — the strongest shared model years that have been on the road for at least two years, where available.
Who Should Buy the Ford Edge vs the Toyota Highlander?
Ford Edge vs Toyota Highlander: Common Questions
- Is the Toyota Highlander more reliable than the Ford Edge?
- Yes, the Highlander has a clear edge. Owners filed about 5.8 complaints per 10,000 sold, against 9.4 for the Edge. The Edge's complaints lean heavily on engine coolant intrusion, while the Highlander's problems are spread across the transmission, brakes, air bags, and bumper cover.
- Which has more recalls, the Highlander or the Edge?
- The Highlander has more. Federal recall records show 66 across nine model years, compared with 32 across seven for the Edge. More recalls do not automatically mean a worse car, since a recall means a fix is available. Run the VIN to confirm the repairs were done.
- What is the biggest problem with the Ford Edge?
- Coolant leaking into the cylinders of the 2.0L EcoBoost engine. Early signs are a check engine light with a misfire, rough starts, or coolant that drops with no puddle. Dealers often call for a long-block replacement, with quotes up to $12,000, and failures cluster between about 50,000 and 100,000 miles.
- What goes wrong with the Toyota Highlander?
- The most common complaint is the transmission. Owners describe a rising whine under acceleration, then a failure, with dealer quotes of $8,500 to $10,000. Other reports include brakes that surge forward at low speed, a front bumper cover that detaches at highway speed, and air bags that did not deploy in front crashes.
- Which Highlander and Edge years should I avoid?
- Avoid the Edge from 2018 and 2019, its weakest years. On the Highlander, be careful with 2024 and 2021, which rank weakest. The newest years of each have fewer complaints partly because they have had less time on the road, so do not treat them as proven.
Related Reliability Comparisons
More Ford Edge comparisons
Decided between Ford Edge and Toyota Highlander? Run a VIN check before you buy — uncover hidden accidents, title issues, and open recalls.
How we score the Ford Edge and Toyota Highlander
Scores weight complaint severity at 35%, repair costs at 30%, recall impact at 20%, and the spread of complaints across systems at 15%, with complaint counts adjusted for US sales. Read the full methodology.
See incorrect data? Report an issue