Last updated: 2026-11-20
Nissan Pathfinder vs Toyota Highlander: Reliability Compared
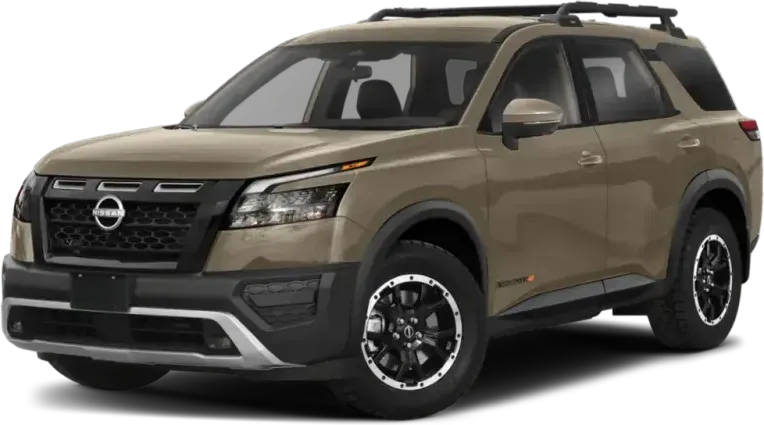 Nissan Pathfinder
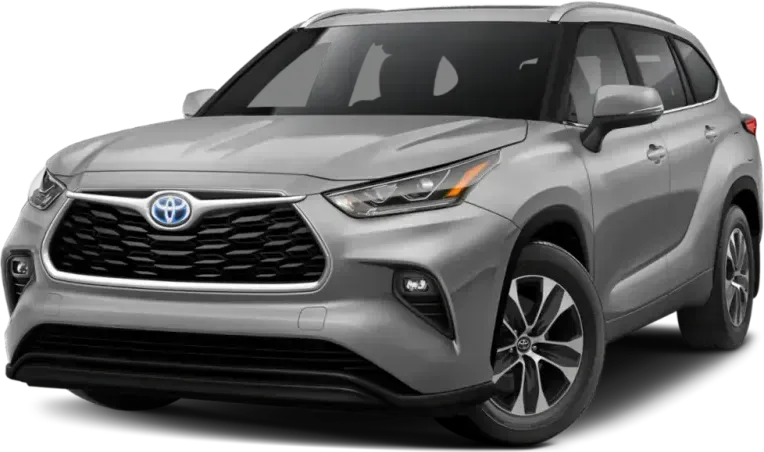 Toyota Highlander
The Highlander takes 3 of 7 rounds (2 drawn)
Reliability is effectively tied between the Toyota Highlander and Nissan Pathfinder, so the choice comes down to which problems you can live with. The Pathfinder has far fewer recalls and complaints. The Highlander costs slightly less to maintain and visits the shop less often.
How Do the Nissan Pathfinder and Toyota Highlander Generations Compare?
Verdict
The Nissan Pathfinder and Toyota Highlander are evenly matched with a reliability score of 73/100.
Reliability is effectively tied. Both stand at good, and neither pulls ahead in a way that should decide the purchase. The Pathfinder has far fewer recalls and complaints, while the Highlander costs a bit less to keep running. What separates them is the kind of failure. The Highlander's worst reports involve transmission failure, lost brake assist, and air bags that did not deploy. The Pathfinder's involve early rear brake wear, stalling, and water leaks. Pick on the specific risks, not on a winner.
Biggest gaps
- Nissan Pathfinder has 30 fewer total recalls
- Nissan Pathfinder has 10.1 fewer complaints per 10k sold
- Toyota Highlander needs 0.1 fewer repairs per year
Round by round
- Reliability ScoreDraw
- Total RecallsPathfinder
- Complaint RatePathfinder
- Annual Repair CostHighlander
- Repair FrequencyHighlander
- Major Repair RiskHighlander
- Safety RatingDraw
Leaning Nissan Pathfinder or Toyota Highlander? Check the exact car before you buy
Whichever wins on paper, the car in front of you has its own past. A VIN check shows its accidents, title history and any open recalls.
Nissan Pathfinder vs Toyota Highlander: Which Is More Reliable?
| Metric | Nissan Pathfinder | Toyota Highlander |
|---|---|---|
| Reliability ScoreOut of 100, higher is better | 73/100 | 73/100 |
| Years Tracked | 8 | 9 |
| Total RecallsLower is better | 14 | 44 |
| Complaints per 10k SoldLower is better | 4.8 | 14.9 |
| Annual Repair CostLower is better | $542/yr | $489/yr |
| Repair FrequencyUnscheduled shop visits a year | 0.4/yr | 0.3/yr |
| Major Repair RiskChance a repair is major | 15% | 13% |
| Safety RatingNHTSA overall | 2026 NHTSA | 2026 NHTSA |
| Frontal | ||
| Side | ||
| Rollover | ||
| Year WinsModel years with the higher score | 4 | 4 |
What Are the Common Problems With the Nissan Pathfinder and Toyota Highlander?
High-stakes failures dominate the Highlander's complaints. A whine from the 8-speed automatic is the early sign of transmission failure, and some cars lost all acceleration in traffic. Brake booster vacuum pump failures drop power assist without warning. Air bags lead on crash links by a wide margin, with owners reporting no deployment in serious collisions. The Pathfinder's complaints lean toward nuisance and repeat visits: rear pads and rotors worn out early, engine stalls dealers cannot reproduce, and rain leaking through the roof or hatch. Its stalling and electrical shutdowns while driving are still a real concern, but its crash links are few. It has no air bag category in its top five.
| Nissan Pathfinder | Problem area | Toyota Highlander |
|---|---|---|
0.4 | Transmission | 4.6 |
1.0 | Brakes | 1.5 |
0.6 | Engine | 0.8 |
0.1 | Body and structure | 1.2 |
0.6 | Electrical | 0.7 |
0.1 | Fuel system | 1.1 |
0.1 | Airbags | 1.0 |
0.1 | Seats | 0.3 |
0.1 | Acceleration and cruise control | 0.1 |
0.2 | Wipers and visibility | <0.1 |
<0.1 | Automatic emergency braking | <0.1 |
<0.1 | Seat belts | <0.1 |
<0.1 | Steering | <0.1 |
<0.1 | Backup camera | 0 |
0 | Wheels and tires | <0.1 |
<0.1 | Stability control | 0 |
<0.1 | Suspension | 0 |
0.7 | Other or unspecified | 1.6 |
Complaints per 10,000 units sold, aggregated across all tracked model years from NHTSA owner reports. Shorter bars mean fewer complaints.
Nissan Pathfinder problem guides
Which Is Cheaper to Maintain: Nissan Pathfinder or Toyota Highlander?
How Does Nissan Pathfinder vs Toyota Highlander Reliability Compare by Year?
| Year | Nissan Pathfinder | Toyota Highlander | Edge |
|---|---|---|---|
| 2026 | 82/1000 recalls · 17 complaints | 88/1000 recalls · 4 complaints | Highlander+6 |
| 2025 | 77/1001 recall · 64 complaints | 76/1004 recalls · 11 complaints | Pathfinder+1 |
| 2024 | 71/1002 recalls · 88 complaints | 75/1007 recalls · 43 complaints | Highlander+4 |
| 2023 | 73/1001 recall · 108 complaints | 71/1009 recalls · 203 complaints | Pathfinder+2 |
| 2022 | 66/1005 recalls · 137 complaints | 71/1006 recalls · 279 complaints | Highlander+5 |
| 2020 | 76/1000 recalls · 53 complaints | 70/1005 recalls · 334 complaints | Pathfinder+6 |
| 2019 | 70/1002 recalls · 76 complaints | 68/1003 recalls · 520 complaints | Pathfinder+2 |
| 2018 | 68/1003 recalls · 79 complaints | 71/1005 recalls · 283 complaints | Highlander+3 |
Best years to cross-shop: The 2020 Nissan Pathfinder scored 76/100 and the 2024 Toyota Highlander scored 75/100, the strongest shared model years that have been on the road for at least two years, where available.
Who Should Buy the Nissan Pathfinder vs the Toyota Highlander?
Team HighlanderChoose the Highlander if you want lower running costs and fewer trips to the shop. Its repair-cost data is a little better. Shop carefully, though. Skip the 2021 and 2019 model years, its weakest, and ask any seller whether the transmission has whined, slipped, or been replaced. Check the brake booster vacuum pump history too. The 2025 and 2026 years look clean, but they have had little time to collect complaints, so do not read that as proof.
Choose the Pathfinder if the Highlander's transmission and air bag reports worry you, since the Pathfinder has far fewer complaints and recalls on file. Plan on early rear brake jobs, and ask for service records showing when the rear pads and rotors were last replaced. Avoid the 2022 and 2018 model years, its weakest. Test drive it at stops with auto start/stop on, and check the headliner, hatch, and sunroof for water stains or a musty smell.
Nissan Pathfinder vs Toyota Highlander: Common Questions
- Is the Toyota Highlander more reliable than the Nissan Pathfinder?
- No, they are effectively tied, and both stand at good. The Highlander has lower repair costs and fewer shop visits. The Pathfinder has far fewer recalls and complaints. The Highlander's problems skew toward transmission failure and brake assist loss, while the Pathfinder's skew toward early rear brake wear and stalling.
- Which has more recalls, the Highlander or the Pathfinder?
- The Highlander has more. Federal recall records show 44 recalls across its 9 model years from 2018 to 2026. The Pathfinder has 14 across 8 model years. Owner complaints follow the same pattern, at 14.9 per 10,000 sold for the Highlander and 4.8 for the Pathfinder.
- Which costs less to repair, the Highlander or the Pathfinder?
- The Highlander costs less. Independent repair-cost data puts it at $489 a year against $542 for the Pathfinder, about $265 over five years. It also has a lower chance that a repair is major, at 13% against 15%, and fewer unscheduled shop visits each year.
- What is the most common Highlander problem?
- Power train problems lead, with 735 owner complaints. A high-pitched whine from the 8-speed automatic, often between 25 and 45 mph, is the usual first sign of transmission failure. Failures range from 39,000 to 136,000 miles, and dealer replacement quotes reach $8,000 or more.
- Do Nissan Pathfinder rear brakes wear out early?
- Many owners say so. Service brakes are the Pathfinder's top complaint area, with 124 reports. Rear pads and rotors often wear to metal between 16,000 and 27,000 miles while the fronts still have material. Dealers often call it normal wear and refuse warranty coverage, so ask for brake service records.
Related Reliability Comparisons
More Nissan Pathfinder comparisons
Decided between Nissan Pathfinder and Toyota Highlander? Run a VIN check before you buy — uncover hidden accidents, title issues, and open recalls.
How we score the Nissan Pathfinder and Toyota Highlander
Scores weight complaint severity at 35%, repair costs at 30%, recall impact at 20%, and the spread of complaints across systems at 15%, with complaint counts adjusted for US sales. Read the full methodology.
See incorrect data? Report an issue