Last updated: 2026-10-10
Buick Enclave vs Toyota Highlander: Reliability Compared
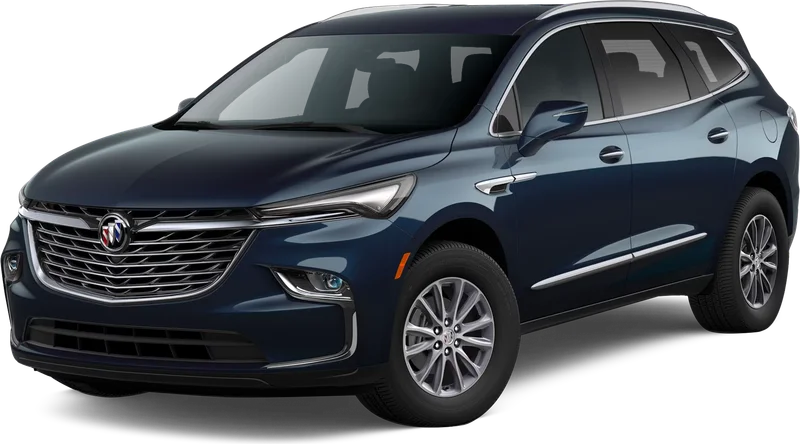
Buick Enclave
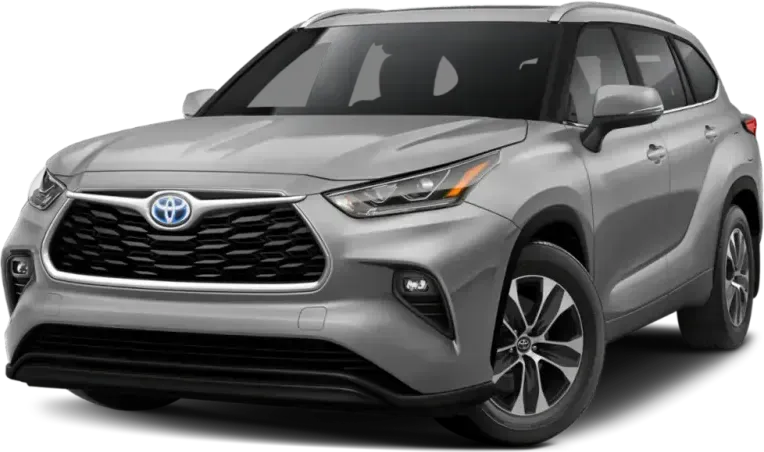
Toyota Highlander
Reliability favors the Buick Enclave slightly over the Toyota Highlander, mainly because it has far fewer recalls and complaints. Each still rates good. The Highlander's transmission failures and reports of air bags not deploying widen the gap.
How Do the Buick Enclave and Toyota Highlander Generations Compare?
Verdict
The Buick Enclave is more reliable than the Toyota Highlander, scoring 76/100 vs 73/100.
Slightly ahead on reliability is the Buick Enclave, and the lead is small because both models rate good. The Enclave has far fewer recalls and far fewer owner complaints per vehicle sold. Its main problem areas also leave out air bags and structure, which are two of the Highlander's biggest. The Highlander carries a heavier record: a long recall list, transmission failures just past the warranty, and air bag reports with many crash links. The Enclave's weak spots, a liftgate that opens on its own and early brake grinding, are real but not as heavy.
Key Differences
- 1Buick Enclave has 56 fewer total recalls
- 2Buick Enclave has 3.2 fewer complaints per 10k sold
- 3Buick Enclave scores 3 points higher in reliability
Category Scoreboard
Buick Enclave vs Toyota Highlander: Which Is More Reliable?
| Metric | Buick Enclave | Toyota Highlander |
|---|---|---|
| Reliability Score | 76/100 | 73/100 |
| Years Tracked | 9 | 9 |
| Total Recalls | 10 | 66 |
| Complaints per 10k Sold | 2.6 | 5.8 |
| Year Wins | 7 | 2 |
What Are the Common Problems With the Buick Enclave and Toyota Highlander?
Expensive and dangerous failures dominate the Highlander's record: a whining transmission that ends in replacement, a forward surge while braking at low speed, a front bumper cover that detaches at highway speed, and front impacts with no air bag deployment. Air bags carry 41 crash-linked complaints, the most of any area on either car. The Enclave's reports are fewer and milder: a liftgate that opens by itself, a transmission that slams into park or jerks, brakes that grind within the first 1,000 miles, and a cracked exhaust bracket. Its steering reports, where assist cuts out mid-turn, are rare but serious.
| Component | Buick Enclave | Toyota Highlander |
|---|---|---|
| POWER TRAIN | 0.4Very Low | 1.5Low |
| UNKNOWN OR OTHER | 0.3Very Low | 0.8Very Low |
| SERVICE BRAKES | 0.4Very Low | 0.5Very Low |
| ELECTRICAL SYSTEM | 0.4Very Low | 0.4Very Low |
| ENGINE | 0.3Very Low | 0.2Very Low |
| STRUCTURE | —None | 0.5Very Low |
| AIR BAGS | —None | 0.5Very Low |
| FUEL/PROPULSION SYSTEM | —None | 0.3Very Low |
| STEERING | 0.1Very Low | 0.1Very Low |
| SEAT BELTS | 0.1Very Low | —None |
| FUEL SYSTEM | —None | 0.1Very Low |
| VEHICLE SPEED CONTROL | —None | 0.1Very Low |
| EXTERIOR LIGHTING | —None | —None |
| ENGINE AND ENGINE COOLING | —None | —None |
| SUSPENSION | —None | —None |
| VISIBILITY/WIPER | —None | —None |
| TIRES | —None | —None |
Complaints per 10,000 units sold, aggregated across all tracked model years from NHTSA owner reports.
How Does Buick Enclave vs Toyota Highlander Reliability Compare by Year?
| Year | Buick Enclave | Toyota Highlander | Edge |
|---|---|---|---|
| 2026 | 81/1000R / 0C | 84/1000R / 0C | Toyota Highlander |
| 2025 | 77/1000R / 31C | 76/1008R / 40C | Buick Enclave |
| 2024 | 77/1000R / 7C | 67/10016R / 198C | Buick Enclave |
| 2023 | 79/1000R / 17C | 73/10013R / 140C | Buick Enclave |
| 2022 | 76/1001R / 12C | 74/1007R / 186C | Buick Enclave |
| 2021 | 75/1002R / 21C | 70/1006R / 403C | Buick Enclave |
| 2020 | 68/1006R / 48C | 71/1008R / 269C | Toyota Highlander |
| 2019 | 75/1001R / 38C | 70/1003R / 414C | Buick Enclave |
| 2018 | 75/1000R / 60C | 72/1005R / 242C | Buick Enclave |
Best years to cross-shop: The 2023 Buick Enclave scored 79/100 and the 2022 Toyota Highlander scored 74/100 — the strongest shared model years that have been on the road for at least two years, where available.
Who Should Buy the Buick Enclave vs the Toyota Highlander?
Buick Enclave vs Toyota Highlander: Common Questions
- Is the Toyota Highlander more reliable than the Buick Enclave?
- No, the Enclave has a slight edge, and both models rate good. The Enclave has far fewer owner complaints per vehicle sold and far fewer recalls. The Highlander's record includes costly transmission failures and air bag non-deployment reports, which are not among the Enclave's main problem areas.
- Which has more recalls, the Highlander or the Enclave?
- The Highlander has far more. Federal recall records show 66 across its 9 model years, against 10 for the Enclave. One Highlander recall, 23V720000, covers a front bumper cover that detaches, and owners often report waiting months for the repair part.
- What is the most common problem with the Toyota Highlander?
- Power train complaints lead, at 485. Owners describe a high-pitched whine under acceleration that grows until the transmission fails. Reports cluster just past the 60,000-mile warranty, and dealers quote $8,500 to $10,000 for replacement. Some owners wait months for a backordered unit.
- What goes wrong with the Buick Enclave?
- Electrical complaints lead, mainly a power liftgate that opens by itself while parked or driving. Owners also report transmissions that slam into park or jerk, brakes that grind within the first 1,000 miles, and a cracked front exhaust bracket. One dealer quoted $1000 for that exhaust fix.
- Which Enclave and Highlander years should I avoid?
- Avoid Enclave years 2020 and 2019, its weakest, and Highlander years 2024 and 2021. For the Enclave, 2023 is among the stronger years. The newest 2025 and 2026 cars of both models have had little time to collect complaints, so their clean records are not yet proof.
Related Reliability Comparisons
More Buick Enclave comparisons
Decided between Buick Enclave and Toyota Highlander? Run a VIN check before you buy — uncover hidden accidents, title issues, and open recalls.
How we score the Buick Enclave and Toyota Highlander
Scores weight complaint severity at 35%, repair costs at 30%, recall impact at 20%, and the spread of complaints across systems at 15%, with complaint counts adjusted for US sales. Read the full methodology.
See incorrect data? Report an issue