Last updated: 2026-05-15
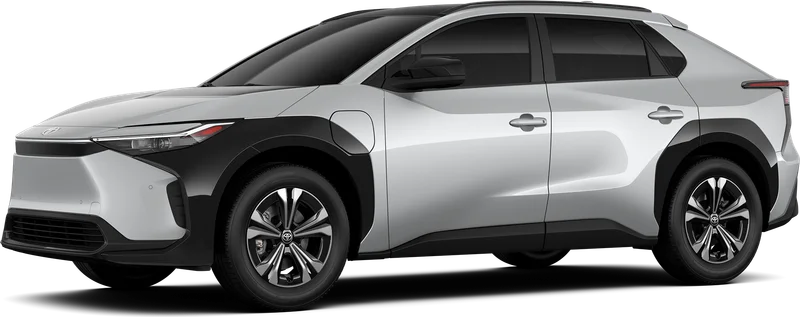
0 Toyota bZ4X Years to Avoid
Years that score significantly below the Toyota bZ4X average of 75/100
All Toyota bZ4X years score consistently around the model average of 75/100 — no years are statistical outliers. The best year is 2025 76/100 and the weakest is 2023 73/100.
Verdict
All Toyota bZ4X years score consistently around the model average of 75/100 (73–76 range) — no years are statistical outliers. The best is 2025 76/100 and the weakest is 2023 73/100.
What Are Common Toyota bZ4X Problems?
Top reported issues across all Toyota bZ4X model years, based on NHTSA owner complaints.
ELECTRICAL SYSTEM
11 complaintsMost reported in 2023, 2024
STRUCTURE
6 complaintsMost reported in 2023, 2024
UNKNOWN OR OTHER
4 complaintsMost reported in 2023, 2024
SUSPENSION
2 complaintsMost reported in 2025
TIRES
2 complaintsMost reported in 2023
Best Toyota bZ4X Year to Buy Instead
2024 Toyota bZ4X
The 2024 Toyota Bz4x has good reliability. There are 3 recalls and 21 owner complaints on file for the 2024 Toyota Bz4x. Severity signals include 2 crash-related complaints. The most commonly reported problem areas are: Electrical System (8), Structure (4), Unknown Or Other (2).
Found a Safe Year? Check the Specific Car
Even the best Toyota bZ4X year can have hidden problems. A VIN check reveals past accidents, title issues, and service gaps for the exact car you're considering.
- Accidents
- Open Recalls
- Title History
- Odometer Rollback
All Toyota bZ4X Years by Generation
All model years ranked by reliability score, grouped by generation.
Toyota bZ4X Reliability Scores by Year
First generation (bZ4X) (2023–2026)
Our data covers 2023–2025 model years.
Frequently Asked Questions
What Toyota bZ4X years should you avoid?
What is the best year for the Toyota bZ4X?
How many recalls does the Toyota bZ4X have?
Is a used Toyota bZ4X worth buying?
What are common Toyota bZ4X problems?
Is the Toyota bZ4X reliable long-term?
Is the 2025 Toyota bZ4X a good used buy?
How We Calculate Reliability Scores
Auto Reliability Index scores are calculated on a 0–100 scale using a weighted formula that combines multiple public data sources. Each factor is weighted based on its predictive value for real-world ownership experience.
Key Ranking Factors
Complaint Severity
NHTSA owner complaints weighted by component category (e.g., powertrain, safety systems, electronics, cosmetic) — safety-critical issues carry more weight than cosmetic ones. Adjusted for sales volume so high-volume models aren't unfairly penalized.
Repair Costs
Independent reliability ratings based on repair frequency, average repair costs, and severity of typical repairs for each model.
Recall Impact
Number of NHTSA recalls weighted by severity. “Stop driving” and fire-risk recalls are penalized more heavily than minor software or labeling recalls.
Issue Diversity
Measures how many major vehicle systems (engine, transmission, electrical, braking, etc.) have recorded complaints. A vehicle with issues spread across many systems may indicate systemic quality issues.
Scores are grouped into four tiers:
- 80–100: Excellent— Top-tier reliability, minimal issues
- 60–79: Good— Reliable with some minor concerns
- 40–59: Mixed— Notable issues, research before buying
- 0–39: Risky— Significant problems, proceed with caution
Data is sourced from NHTSA recall records, owner complaint filings, and independent repair databases via vehicles.dev. Scores are recalculated as new data becomes available. While the weighting model is proprietary, all underlying data sources are public and traceable.
See incorrect data? Report an issue