Last updated: 2026-10-10
Chevrolet Traverse vs Honda Passport: Reliability Compared
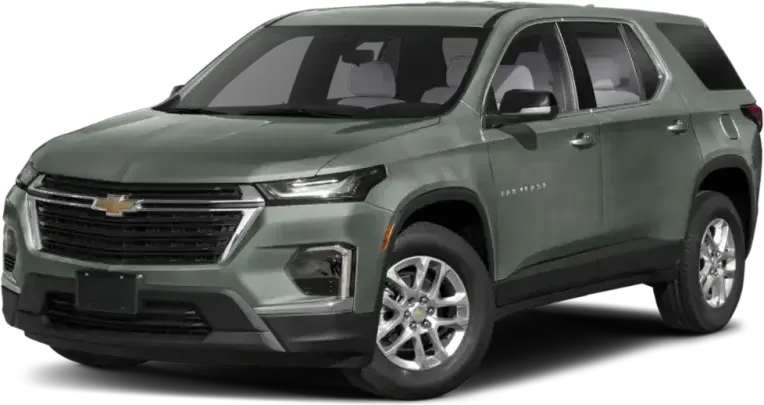
Chevrolet Traverse
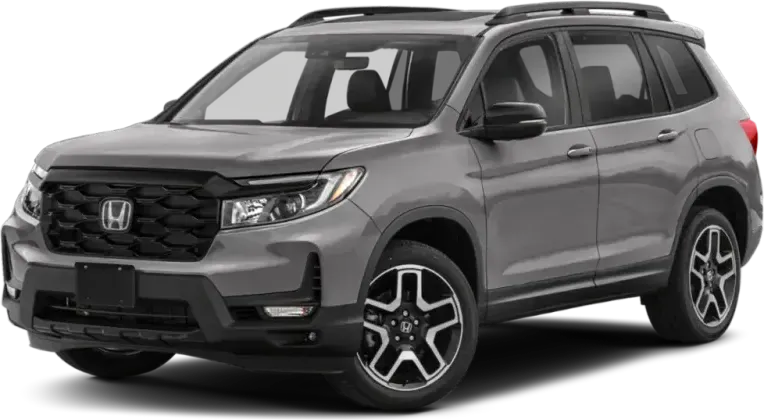
Honda Passport
Passport owners spend less on repairs, which gives the Honda Passport a slight reliability edge over the Chevrolet Traverse. Both rate well. The Traverse draws more crash-linked complaints in its brakes, power train and electrical system, while the Passport has more recalls on record.
How Do the Chevrolet Traverse and Honda Passport Generations Compare?
Verdict
The Honda Passport is more reliable than the Chevrolet Traverse, scoring 74/100 vs 70/100.
Slight edge to the Passport. Both sit in good standing, so the gap is small. The deciding factors are cost and shop time: the Passport is cheaper to keep running and needs fewer unscheduled visits. Owner complaints for the Traverse also include more crash-linked reports, especially in the brakes, power train and electrical system. The Passport is not spotless. It has more recalls and a higher complaint rate for the number sold. Its edge rests on repair costs and fewer serious reports, not on a clean record.
Key Differences
- 1Honda Passport costs $135 less per year to repair
- 2Chevrolet Traverse has 10 fewer total recalls
- 3Chevrolet Traverse has 4.4 fewer complaints per 10k sold
Category Scoreboard
Chevrolet Traverse vs Honda Passport: Which Is More Reliable?
| Metric | Chevrolet Traverse | Honda Passport |
|---|---|---|
| Reliability Score | 70/100 | 74/100 |
| Years Tracked | 9 | 8 |
| Total Recalls | 19 | 29 |
| Complaints per 10k Sold | 7.2 | 11.6 |
| Annual Repair Cost | $656/yr | $521/yr |
| Repair Frequency | 0.4/yr | 0.3/yr |
| Year Wins | 2 | 6 |
What Are the Common Problems With the Chevrolet Traverse and Honda Passport?
Drivetrain and exhaust trouble dominate the Traverse complaints. AWD shuts off with service messages, the car can act as if it is in park while in drive, alternators fail early, and front exhaust bracket welds crack. Its brakes sometimes fail to stop the car at low speeds, and that area has 7 crash-linked complaints. Passport complaints lean toward electronics and driver aids: the engine not restarting after Auto Idle Stop, phantom braking, and the transmission shifting into neutral while driving. Only the Passport has a forward collision avoidance problem area. Only its engine area has a crash-linked complaint, while the Traverse engine area has none.
| Component | Chevrolet Traverse | Honda Passport |
|---|---|---|
| ELECTRICAL SYSTEM | 1.1Low | 2.6Low |
| POWER TRAIN | 2.2Low | 1.2Low |
| UNKNOWN OR OTHER | 0.9Very Low | 1.2Low |
| SERVICE BRAKES | 0.7Very Low | 1Very Low |
| FORWARD COLLISION AVOIDANCE | —None | 1.4Low |
| ENGINE | 0.6Very Low | 0.7Very Low |
| FUEL SYSTEM | —None | 0.5Very Low |
| STEERING | 0.2Very Low | 0.1Very Low |
| AIR BAGS | 0.1Very Low | 0.2Very Low |
| STRUCTURE | 0.1Very Low | 0.2Very Low |
| FUEL/PROPULSION SYSTEM | 0.1Very Low | 0.2Very Low |
| ENGINE AND ENGINE COOLING | 0.2Very Low | —None |
| SEAT BELTS | 0.1Very Low | —None |
| SUSPENSION | 0.1Very Low | —None |
| VEHICLE SPEED CONTROL | —None | 0.1Very Low |
| LANE DEPARTURE | —None | 0.1Very Low |
| VISIBILITY | —None | 0.1Very Low |
| TIRES | —None | 0.1Very Low |
| VISIBILITY/WIPER | —None | 0.1Very Low |
| SEATS | —None | —None |
| EXTERIOR LIGHTING | —None | —None |
| BACK OVER PREVENTION | —None | —None |
Complaints per 10,000 units sold, aggregated across all tracked model years from NHTSA owner reports.
Which Is Cheaper to Maintain: Chevrolet Traverse or Honda Passport?
How Does Chevrolet Traverse vs Honda Passport Reliability Compare by Year?
| Year | Chevrolet Traverse | Honda Passport | Edge |
|---|---|---|---|
| 2026 | 76/1000R / 6C | 84/1000R / 0C | Honda Passport |
| 2025 | 75/1000R / 132C | 82/1000R / 11C | Honda Passport |
| 2024 | 73/1000R / 107C | 79/1001R / 12C | Honda Passport |
| 2023 | 72/1002R / 62C | 75/1004R / 24C | Honda Passport |
| 2022 | 73/1001R / 76C | 74/1003R / 45C | Honda Passport |
| 2021 | 71/1003R / 72C | 68/1005R / 119C | Chevrolet Traverse |
| 2020 | 62/1008R / 188C | 68/1008R / 84C | Honda Passport |
| 2019 | 62/1003R / 358C | 59/1008R / 253C | Chevrolet Traverse |
Best years to cross-shop: The 2024 Chevrolet Traverse scored 73/100 and the 2024 Honda Passport scored 79/100 — the strongest shared model years that have been on the road for at least two years, where available.
Who Should Buy the Chevrolet Traverse vs the Honda Passport?
Chevrolet Traverse vs Honda Passport: Common Questions
- Is the Chevrolet Traverse more reliable than the Honda Passport?
- No. The Passport has a slight edge, though both are in good standing. It costs less per year to repair and needs fewer unscheduled shop visits. The Traverse also has more crash-linked complaints, with the most in its brakes, power train and electrical system, which pulls its standing down a little.
- Which has more recalls, the Traverse or the Passport?
- The Passport has more. Federal recall records show 29 recalls across 8 model years for the Passport and 19 across 9 model years for the Traverse. Recall count alone does not decide reliability, so weigh it with repair cost and the kinds of complaints owners file.
- Which costs less to repair, the Traverse or the Passport?
- The Passport. Independent repair-cost data estimates $521 a year against $656 for the Traverse. Over five years that adds up to about $675 in savings. The Passport also averages 0.3 unscheduled shop visits a year, compared with 0.4 for the Traverse.
- What is wrong with the Traverse exhaust?
- Front exhaust pipe brackets crack at the welds, and the pipe can then tear. It starts as a rattle at startup and grows into a loud clang. Owners also report exhaust fumes in the cabin. GM special coverage applied to 2019 and 2021 models but not 2020, and welded patches often crack again.
- What is the Passport phantom braking problem?
- Owners report the SUV braking hard with nothing ahead, along with a flashing red BRAKE warning and a shaking steering wheel. Oncoming cars in the next lane and curves are common triggers. Dealers often cannot reproduce it. One complaint ties false braking to a crash.
Related Reliability Comparisons
More Chevrolet Traverse comparisons
Decided between Chevrolet Traverse and Honda Passport? Run a VIN check before you buy — uncover hidden accidents, title issues, and open recalls.
How we score the Chevrolet Traverse and Honda Passport
Scores weight complaint severity at 35%, repair costs at 30%, recall impact at 20%, and the spread of complaints across systems at 15%, with complaint counts adjusted for US sales. Read the full methodology.
See incorrect data? Report an issue