Last updated: 2026-10-10
Hyundai Kona vs Toyota RAV4: Reliability Compared
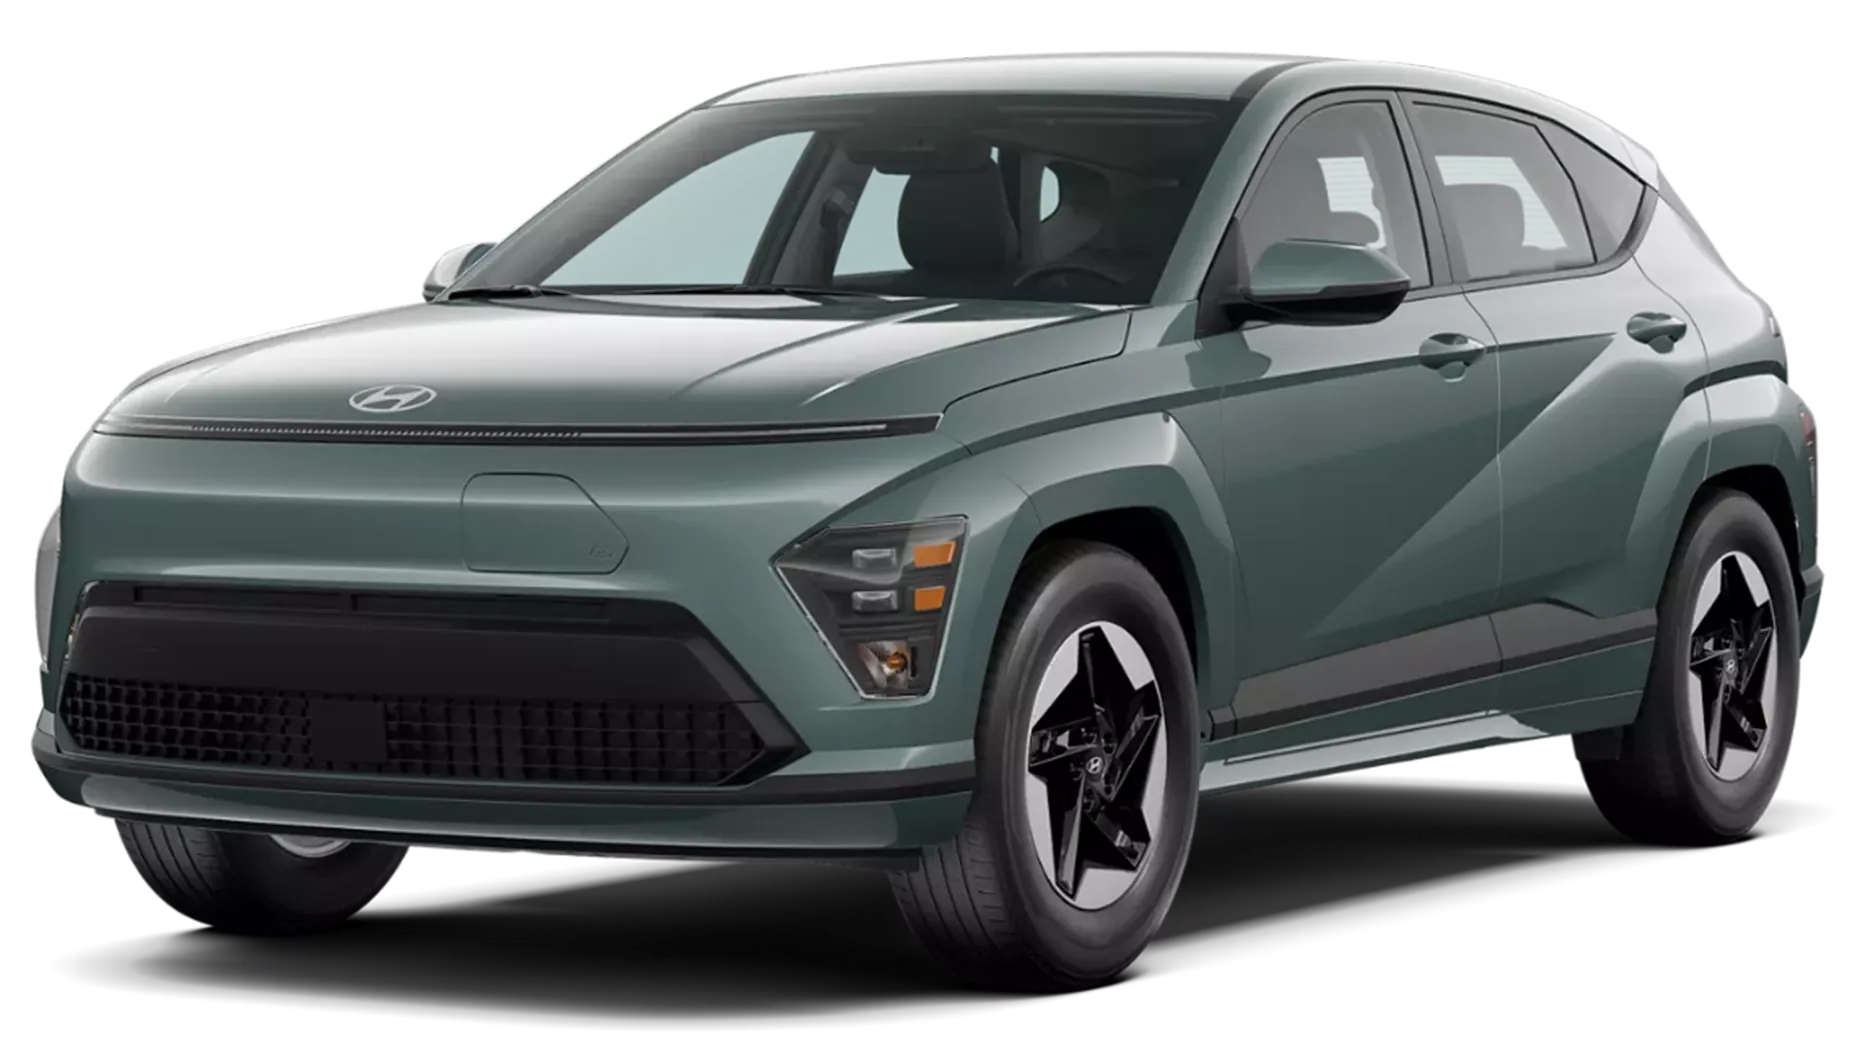
Hyundai Kona
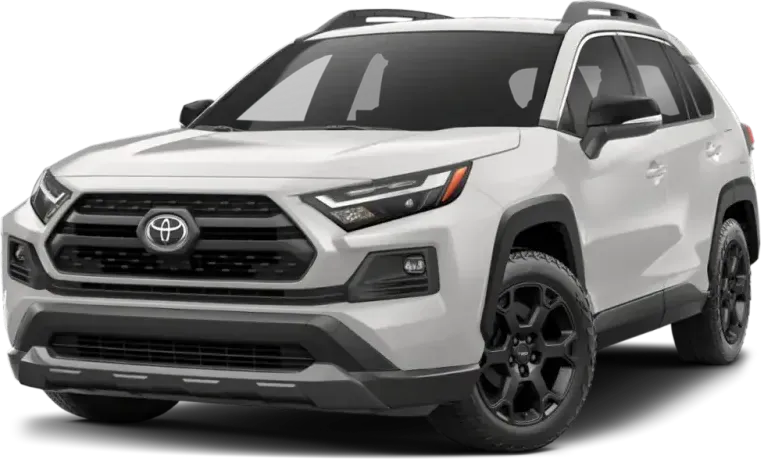
Toyota RAV4
On reliability, the Toyota RAV4 clearly beats the Hyundai Kona, with 4.4 complaints per 10,000 sold against the Kona's 13.4. Both hold a good standing. The Kona's engine, transmission, and braking reports are what set it back, while the RAV4 carries more recalls.
How Do the Hyundai Kona and Toyota RAV4 Generations Compare?
Verdict
The Toyota RAV4 is more reliable than the Hyundai Kona, scoring 76/100 vs 65/100.
A large gap favors the Toyota RAV4. Owners file complaints at about a third of the Kona's rate per car sold, and the RAV4's problems are mostly warning lights, coolant parts, and fuel-fill quirks. The Kona's reports include power cutting out on the road, early transmission failures, and cars that will not restart. The RAV4 does carry far more recalls and serious air bag complaints, so it is not flawless. Both models still hold a good standing.
Key Differences
- 1Hyundai Kona has 37 fewer total recalls
- 2Toyota RAV4 scores 11 points higher in reliability
- 3Toyota RAV4 has 9.0 fewer complaints per 10k sold
Category Scoreboard
Hyundai Kona vs Toyota RAV4: Which Is More Reliable?
| Metric | Hyundai Kona | Toyota RAV4 |
|---|---|---|
| Reliability Score | 65/100 | 76/100 |
| Years Tracked | 9 | 8 |
| Total Recalls | 16 | 53 |
| Complaints per 10k Sold | 13.4 | 4.4 |
| Safety RatingNHTSA overall | 2026 NHTSA | 2025 NHTSA |
| Frontal | ||
| Side | ||
| Rollover | ||
| Year Wins | 0 | 8 |
What Are the Common Problems With the Hyundai Kona and Toyota RAV4?
Lost power and stalled cars define the Kona's complaints: engines cutting out at highway speed, transmissions failing at 4,000 to 7,000 miles, and horns that keep failing after replacement. Its adaptive cruise and automatic emergency braking reports add crash-linked risk, including hard braking at highway speed for no visible reason. The RAV4's complaints lean toward floods of dashboard warnings, coolant bypass valve failure, and hybrid tanks that will not fill. Its most serious area is air bags that stayed folded in crashes, which the Kona's main list lacks. RAV4 owners also report cars moving after being shifted into park.
| Component | Hyundai Kona | Toyota RAV4 |
|---|---|---|
| ENGINE | 4.5Average | 0.5Very Low |
| ELECTRICAL SYSTEM | 3.3Average | 0.7Very Low |
| UNKNOWN OR OTHER | 1.8Low | 0.7Very Low |
| POWER TRAIN | 1.6Low | 0.3Very Low |
| FUEL/PROPULSION SYSTEM | 0.2Very Low | 0.5Very Low |
| AIR BAGS | 0.2Very Low | 0.4Very Low |
| VEHICLE SPEED CONTROL | 0.5Very Low | 0.1Very Low |
| SERVICE BRAKES | 0.4Very Low | 0.1Very Low |
| STEERING | 0.3Very Low | 0.2Very Low |
| STRUCTURE | 0.1Very Low | 0.2Very Low |
| FORWARD COLLISION AVOIDANCE | 0.2Very Low | —None |
| ENGINE AND ENGINE COOLING | 0.2Very Low | —None |
| EXTERIOR LIGHTING | 0.1Very Low | —None |
| LANE DEPARTURE | —None | —None |
| VISIBILITY | —None | —None |
| WHEELS | —None | —None |
| VISIBILITY/WIPER | —None | —None |
| TIRES | —None | —None |
| BACK OVER PREVENTION | —None | —None |
Complaints per 10,000 units sold, aggregated across all tracked model years from NHTSA owner reports.
How Does Hyundai Kona vs Toyota RAV4 Reliability Compare by Year?
| Year | Hyundai Kona | Toyota RAV4 | Edge |
|---|---|---|---|
| 2025 | 74/1000R / 21C | 84/1005R / 49C | Toyota RAV4 |
| 2024 | 68/1003R / 50C | 80/1006R / 150C | Toyota RAV4 |
| 2023 | 66/1002R / 68C | 80/1006R / 147C | Toyota RAV4 |
| 2022 | 64/1002R / 115C | 80/1006R / 133C | Toyota RAV4 |
| 2021 | 63/1001R / 102C | 73/1006R / 450C | Toyota RAV4 |
| 2020 | 57/1002R / 140C | 70/10011R / 611C | Toyota RAV4 |
| 2019 | 55/1004R / 224C | 66/10010R / 864C | Toyota RAV4 |
| 2018 | 69/1000R / 66C | 76/1003R / 330C | Toyota RAV4 |
Best years to cross-shop: The 2018 Hyundai Kona scored 69/100 and the 2024 Toyota RAV4 scored 80/100 — the strongest shared model years that have been on the road for at least two years, where available.
Who Should Buy the Hyundai Kona vs the Toyota RAV4?
Hyundai Kona vs Toyota RAV4: Common Questions
- Is the Hyundai Kona more reliable than the Toyota RAV4?
- No. The RAV4 leads by a large margin. Owners file 4.4 complaints per 10,000 RAV4s sold versus 13.4 for the Kona. Both earn a good standing, but the Kona has more reports of power loss, transmission failure, and electrical faults like the horn and 12V battery.
- Which has more recalls, the Kona or the RAV4?
- The RAV4 has more. Federal recall records show 53 recalls across 8 model years for the RAV4, against 16 across 9 model years for the Kona. Recalls are free fixes, so check that open ones on any used car were completed before you buy.
- Which model years of the Kona and RAV4 should I avoid?
- Avoid 2019 and 2020 on both. Those are the weakest years for each model in the data. For the RAV4, 2022 is one of the strongest years. For the Kona, 2018 is one of the strongest.
- Do RAV4 hybrids have fuel tank problems?
- Yes, owners report it often. The main complaint, mostly on Hybrid and Prime models, is that the pump clicks off early and the 14.5-gallon tank takes only 10 to 11 gallons after the low-fuel light comes on. Owners say dealers often call this within spec.
- What are the most serious Kona problems?
- Engine power loss and braking events stand out. Owners report power cutting out at highway speed, and some cars will not restart. Others describe automatic emergency braking firing at about 60 mph with no cars nearby. Adaptive cruise and brake complaints include crash-linked reports.
Related Reliability Comparisons
More Hyundai Kona comparisons
Decided between Hyundai Kona and Toyota RAV4? Run a VIN check before you buy — uncover hidden accidents, title issues, and open recalls.
How we score the Hyundai Kona and Toyota RAV4
Scores weight complaint severity at 35%, repair costs at 30%, recall impact at 20%, and the spread of complaints across systems at 15%, with complaint counts adjusted for US sales. Read the full methodology.
See incorrect data? Report an issue