Last updated: 2026-10-10
Lexus ES vs Tesla Model 3: Reliability Compared
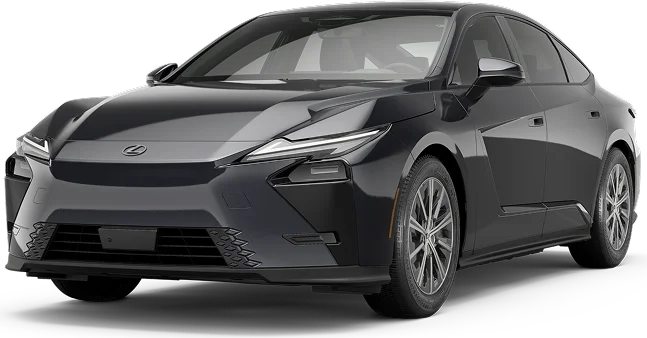
Lexus ES
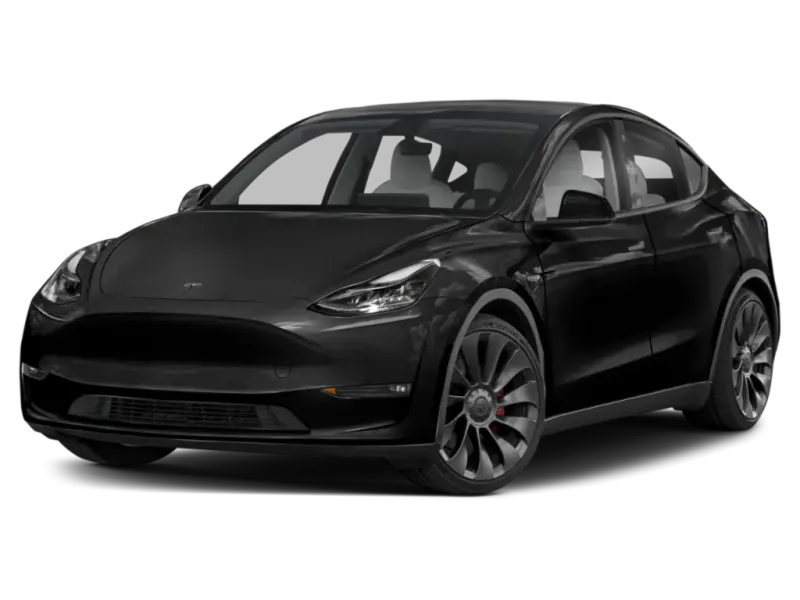
Tesla Model 3
The Lexus ES is clearly more reliable than the Tesla Model 3. Federal recall records show 15 recalls for the ES across eight model years and 113 for the Model 3 across nine. Tesla owners also report far more serious braking, acceleration, and steering problems.
How Do the Lexus ES and Tesla Model 3 Generations Compare?
Verdict
The Lexus ES is more reliable than the Tesla Model 3, scoring 83/100 vs 55/100.
The more reliable car is the Lexus ES, and the gap is large. Federal recall records show 15 recalls across eight ES model years, against 113 across nine for the Model 3. Tesla owner complaints also pile up in serious areas: phantom braking, unintended acceleration while parking, and steering wear. The ES complaint list is short and spread thin. Its main weak spot is stalling that owners tie to a low-pressure fuel pump.
Key Differences
- 1Lexus ES has 98 fewer total recalls
- 2Lexus ES scores 28 points higher in reliability
Category Scoreboard
Lexus ES vs Tesla Model 3: Which Is More Reliable?
| Metric | Lexus ES | Tesla Model 3 |
|---|---|---|
| Reliability Score | 83/100 | 55/100 |
| Years Tracked | 8 | 9 |
| Total Recalls | 15 | 113 |
| Total ComplaintsRaw count — varies with sales volume | 95 | 3948 |
| Year Wins | 8 | 0 |
What Are the Common Problems With the Lexus ES and Tesla Model 3?
Tesla owners report phantom braking on open highway, surging into garages and storefronts with a foot on the brake, failed charging, blank touchscreens, and control arm wear that brings clunking and pulling. Lexus owners mostly report stalling and weak throttle response, which they link to a fuel pump, plus automatic braking that fires on its own. Both have crash-linked brake complaints. Only the Tesla list has large crash-linked groups in vehicle speed control and steering. Lexus also has airbag non-deployment reports, which is serious but rare.
| Component | Lexus ES | Tesla Model 3 |
|---|---|---|
| FORWARD COLLISION AVOIDANCE | — | 841 |
| VEHICLE SPEED CONTROL | 2 | 511 |
| UNKNOWN OR OTHER | 6 | 427 |
| ELECTRICAL SYSTEM | 4 | 411 |
| STEERING | — | 356 |
| SERVICE BRAKES | 5 | 290 |
| AIR BAGS | 8 | 230 |
| SUSPENSION | — | 216 |
| STRUCTURE | 2 | 90 |
| POWER TRAIN | 3 | 50 |
| LANE DEPARTURE | 2 | 48 |
| EXTERIOR LIGHTING | — | 22 |
| SEATS | — | 11 |
| WHEELS | 2 | 7 |
| FUEL/PROPULSION SYSTEM | 7 | — |
| ENGINE | 6 | — |
| FUEL SYSTEM | 3 | — |
| BACK OVER PREVENTION | — | 3 |
| TIRES | 2 | — |
Raw complaint counts aggregated across all tracked model years from NHTSA owner reports. Counts vary with sales volume.
How Does Lexus ES vs Tesla Model 3 Reliability Compare by Year?
| Year | Lexus ES | Tesla Model 3 | Edge |
|---|---|---|---|
| 2025 | 83/1001R / 4C | 67/1003R / 87C | Lexus ES |
| 2024 | 80/1004R / 9C | 62/1004R / 183C | Lexus ES |
| 2023 | 80/1004R / 18C | 57/10010R / 386C | Lexus ES |
| 2022 | 88/1000R / 16C | 50/10016R / 729C | Lexus ES |
| 2021 | 88/1000R / 0C | 48/10020R / 626C | Lexus ES |
| 2020 | 83/1001R / 5C | 54/10020R / 416C | Lexus ES |
| 2019 | 78/1003R / 33C | 49/10021R / 569C | Lexus ES |
| 2018 | 80/1002R / 10C | 46/10018R / 951C | Lexus ES |
Best years to cross-shop: The 2022 Lexus ES scored 88/100 and the 2024 Tesla Model 3 scored 62/100 — the strongest shared model years that have been on the road for at least two years, where available.
Who Should Buy the Lexus ES vs the Tesla Model 3?
Lexus ES vs Tesla Model 3: Common Questions
- Is the Tesla Model 3 more reliable than the Lexus ES?
- No. The Lexus ES comes out well ahead. It has far fewer recalls and a short list of owner complaints. The Model 3 has a mixed standing, with thousands of complaints about phantom braking, unintended acceleration, electrical failures, and front suspension wear.
- Which has more recalls, the Model 3 or the ES?
- The Model 3 has many more. Federal recall records show 113 recalls across nine Model 3 model years. The ES has 15 across eight model years. Recall counts grow with time on the road, but this gap is far too wide to explain that way.
- What goes wrong most often on the Lexus ES?
- Stalling and weak throttle response lead the ES complaints. Drivers press the gas at a stop or while merging and get no response. Most of these reports blame a low-pressure fuel pump, and owners describe waiting months for a remedy. Automatic braking that fires on its own is the next concern.
- Does the Tesla Model 3 have a phantom braking problem?
- Yes, it is the most common complaint in its two biggest problem areas. Owners describe hard stops on open highway, near overpasses, and at hill crests with nothing ahead. Some say it happened several times on one trip and service found nothing wrong. One stop caused whiplash.
- Which Model 3 and ES years should I avoid?
- Avoid 2018 and 2021 for the Model 3. Early 2018 cars also have reports of rusted brake lines. For the ES, avoid 2018 and 2019, and look at 2021 or 2022 instead. Newer Tesla years rank well but have had less time to collect complaints.
Related Reliability Comparisons
More Lexus ES comparisons
Decided between Lexus ES and Tesla Model 3? Run a VIN check before you buy — uncover hidden accidents, title issues, and open recalls.
How we score the Lexus ES and Tesla Model 3
Scores weight complaint severity at 35%, repair costs at 30%, recall impact at 20%, and the spread of complaints across systems at 15%, with complaint counts adjusted for US sales. Read the full methodology.
See incorrect data? Report an issue