Last updated: 2026-10-10
Acura TLX vs Lexus ES: Reliability Compared
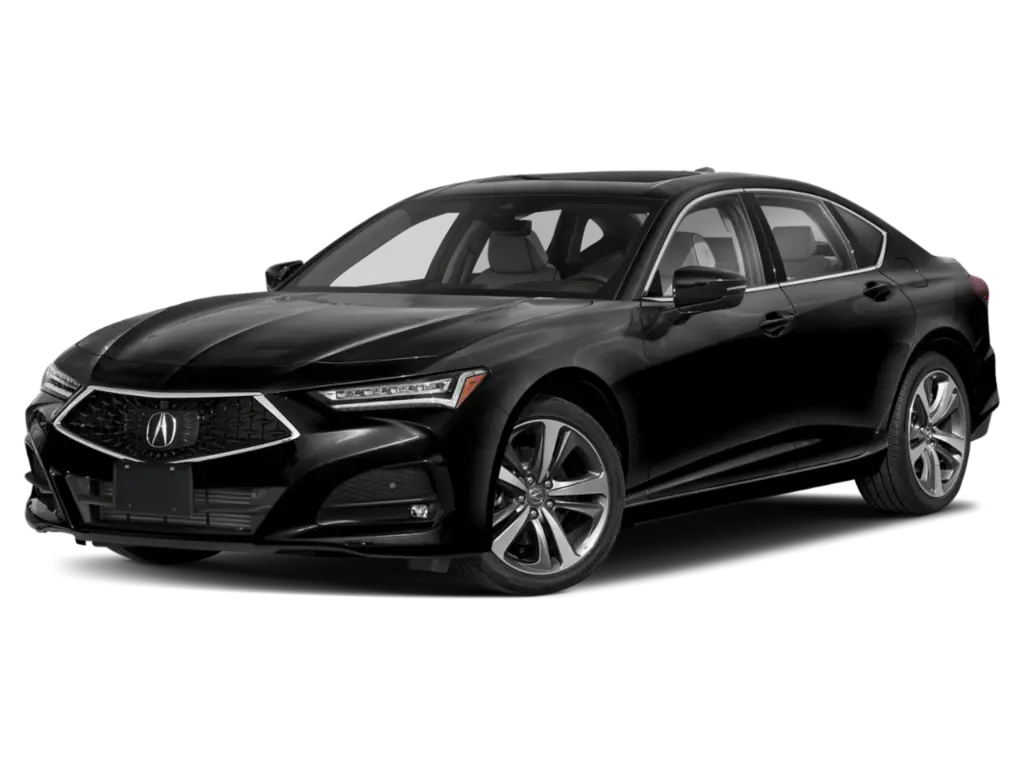
Acura TLX
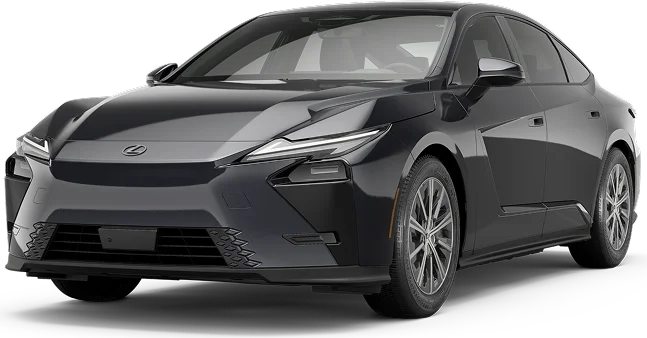
Lexus ES
Reliability favors the Lexus ES over the Acura TLX by a clear margin. The deciding fact is engine failure. TLX owners report connecting rod bearing failures that can seize the engine, while ES complaints are fewer and mostly about fuel pump stalling and braking.
How Do the Acura TLX and Lexus ES Generations Compare?
Verdict
The Lexus ES is more reliable than the Acura TLX, scoring 83/100 vs 75/100.
Reliability favors the Lexus ES by a clear margin. Its standing is excellent, while the Acura TLX rates good. The deciding gap is engine trouble. TLX owners report connecting rod bearing failure that can end in a seized engine, and one out-of-warranty repair was quoted at $20k. ES complaints are fewer and center on stalling from a low-pressure fuel pump and on braking systems. The TLX is still a sound choice with low yearly repair costs, but its worst failure is more severe.
Key Differences
- 1Lexus ES scores 8 points higher in reliability
- 2Lexus ES has 7 fewer total recalls
Category Scoreboard
Acura TLX vs Lexus ES: Which Is More Reliable?
What Are the Common Problems With the Acura TLX and Lexus ES?
Connecting rod failure dominates the TLX complaints. Owners hear ticking or knocking that grows louder until the engine seizes or stalls at highway speed, and dealers often replace the whole engine. Idle stop that fails to restart the engine at lights adds more stalls. The ES problems are scattered. Its owners report stalling and weak throttle response tied to a fuel pump, plus automatic braking that fires on its own. Only the ES lists air bag complaints, with five crash-linked reports of bags not deploying. Both models have crash-linked brake complaints.
| Component | Acura TLX | Lexus ES |
|---|---|---|
| POWER TRAIN | 79 | 3 |
| ENGINE | 49 | 6 |
| ELECTRICAL SYSTEM | 46 | 4 |
| UNKNOWN OR OTHER | 27 | 6 |
| ENGINE AND ENGINE COOLING | 30 | — |
| FUEL/PROPULSION SYSTEM | 15 | 7 |
| SERVICE BRAKES | 16 | 5 |
| FUEL SYSTEM | 16 | 3 |
| AIR BAGS | 8 | 8 |
| FORWARD COLLISION AVOIDANCE | 15 | — |
| STEERING | 14 | — |
| SUSPENSION | 9 | — |
| VEHICLE SPEED CONTROL | 3 | 2 |
| STRUCTURE | 2 | 2 |
| SEAT BELTS | 2 | — |
| LANE DEPARTURE | — | 2 |
| TIRES | — | 2 |
| WHEELS | — | 2 |
Raw complaint counts aggregated across all tracked model years from NHTSA owner reports. Counts vary with sales volume.
How Does Acura TLX vs Lexus ES Reliability Compare by Year?
| Year | Acura TLX | Lexus ES | Edge |
|---|---|---|---|
| 2025 | 80/1001R / 3C | 83/1001R / 4C | Lexus ES |
| 2024 | 80/1001R / 4C | 80/1004R / 9C | Tie |
| 2023 | 79/1002R / 13C | 80/1004R / 18C | Lexus ES |
| 2022 | 75/1003R / 26C | 88/1000R / 16C | Lexus ES |
| 2021 | 71/1003R / 79C | 88/1000R / 0C | Lexus ES |
| 2020 | 71/1004R / 59C | 83/1001R / 5C | Lexus ES |
| 2019 | 69/1005R / 87C | 78/1003R / 33C | Lexus ES |
| 2018 | 71/1003R / 90C | 80/1002R / 10C | Lexus ES |
Best years to cross-shop: The 2024 Acura TLX scored 80/100 and the 2022 Lexus ES scored 88/100 — the strongest shared model years that have been on the road for at least two years, where available.
Who Should Buy the Acura TLX vs the Lexus ES?
Acura TLX vs Lexus ES: Common Questions
- Is the Acura TLX more reliable than the Lexus ES?
- No. The Lexus ES has the clear edge, with an excellent standing against good for the TLX. The TLX has a pattern of connecting rod bearing failure that can seize the engine. ES owners file fewer complaints, though ES stalling and braking reports are serious.
- Which has more recalls, the TLX or the ES?
- The TLX has more. Federal recall records show 22 recalls across model years 2018 to 2025 for the Acura, against 15 for the Lexus over the same span. Check any specific car's VIN for open recall work before buying.
- What is the biggest problem with the Acura TLX?
- Connecting rod bearing failure. Owners describe ticking or knocking that gets louder until the engine seizes, loses power, or stalls at highway speed. Dealers often replace the whole engine, and some owners waited on backordered recall parts. One out-of-warranty repair was quoted at $20k.
- What goes wrong with the Lexus ES?
- Stalling and weak throttle response lead the list, mostly tied to a low-pressure fuel pump. Owners also report automatic emergency braking that fires on its own and air bags that did not deploy in crashes. Some owners waited months for a fuel pump remedy.
- Which Acura TLX and Lexus ES years should I avoid?
- Avoid the 2019 and 2021 TLX, and the 2018 and 2019 ES, since those are the weakest years for each. The ES did best in 2021 and 2022. TLX 2024 and 2025 rate well but are too new to judge fairly.
Related Reliability Comparisons
More Acura TLX comparisons
Decided between Acura TLX and Lexus ES? Run a VIN check before you buy — uncover hidden accidents, title issues, and open recalls.
How we score the Acura TLX and Lexus ES
Scores weight complaint severity at 35%, repair costs at 30%, recall impact at 20%, and the spread of complaints across systems at 15%, with complaint counts adjusted for US sales. Read the full methodology.
See incorrect data? Report an issue