Last updated: 2026-10-10
Acura TLX vs BMW 3 Series: Reliability Compared
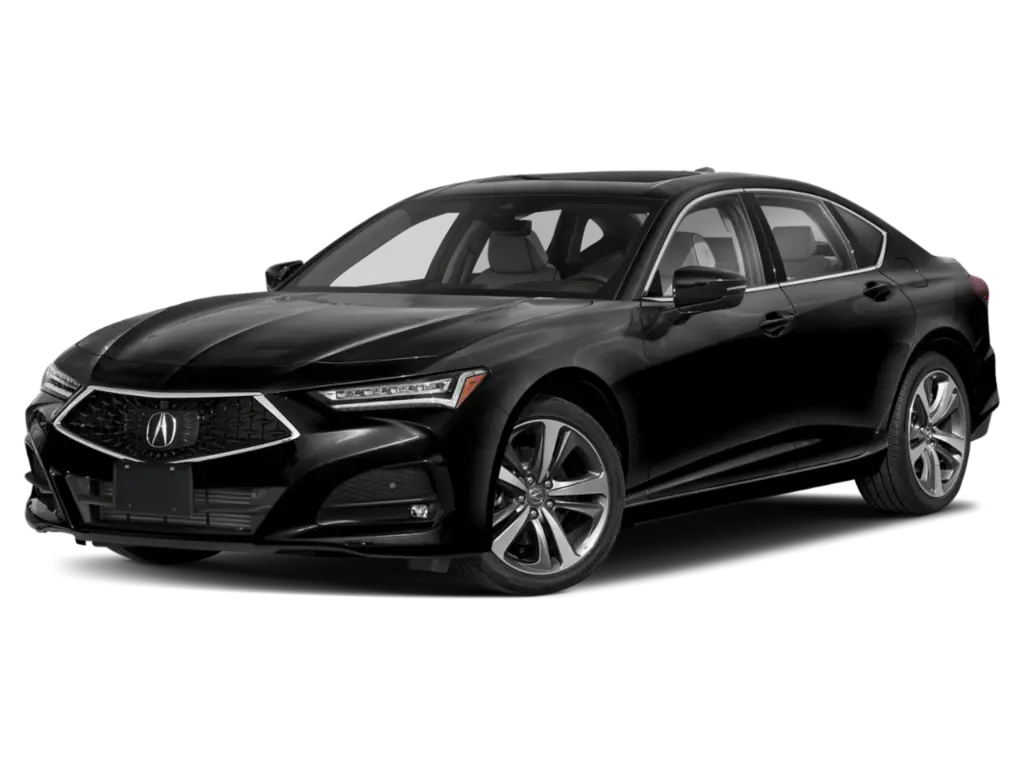
Acura TLX

BMW 3 Series
Reliability favors the Acura TLX over the BMW 3-Series by a clear edge. Repairs run about $440 a year against $773, and the TLX visits the shop far less. The BMW also has more recalls, 45 against 22.
How Do the Acura TLX and BMW 3 Series Generations Compare?
Verdict
The Acura TLX is more reliable than the BMW 3 Series, scoring 75/100 vs 69/100.
Lower repair costs and fewer shop visits decide this one, and the Acura earns a clear edge. Independent repair-cost data shows it needing the shop far less often, and only 6% of its repairs are major, against 12% for the BMW. Owners file more complaints about the TLX, but many trace to one defect, connecting rod failure. The 3-Series carries more recalls, 45 against 22, and several are stuck waiting on parts. Both stand well, but the Acura is the cheaper, calmer car to own.
Key Differences
- 1Acura TLX costs $333 less per year to repair
- 2Acura TLX has 23 fewer total recalls
- 3BMW 3 Series has 11.5 fewer complaints per 10k sold
Category Scoreboard
Acura TLX vs BMW 3 Series: Which Is More Reliable?
| Metric | Acura TLX | BMW 3 Series |
|---|---|---|
| Reliability Score | 75/100 | 69/100 |
| Years Tracked | 8 | 9 |
| Total Recalls | 22 | 45 |
| Complaints per 10k Sold | 12.6 | 1.1 |
| Annual Repair Cost | $440/yr | $773/yr |
| Repair Frequency | 0.2/yr | 1/yr |
| Major Repair Risk | 6% | 12% |
| Safety RatingNHTSA overall | 2025 NHTSA | 2026 NHTSA |
| Frontal | ||
| Side | ||
| Rollover | ||
| Year Wins | 8 | 0 |
What Are the Common Problems With the Acura TLX and BMW 3 Series?
Rod failure is the TLX's big problem. Connecting rod bearings wear, the engine ticks or knocks, and it can seize or stall at highway speed. Owners also report waits for recall parts. Other TLX issues include a hard bang into second gear, idle stop failing to restart the engine, and worn shifter labels. The BMW's trouble is a starter recall, campaign 25V636000, with no parts for many dealers, plus early motor mount failure and a fire report. Only the BMW has crash-linked air bag complaints, five in all, including restraint warnings with no prior damage.
| Component | Acura TLX | BMW 3 Series |
|---|---|---|
| POWER TRAIN | 2.7Low | 0.1Very Low |
| ENGINE | 1.7Low | 0.2Very Low |
| ELECTRICAL SYSTEM | 1.6Low | 0.2Very Low |
| UNKNOWN OR OTHER | 0.9Very Low | 0.2Very Low |
| ENGINE AND ENGINE COOLING | 1Very Low | —None |
| SERVICE BRAKES | 0.6Very Low | —None |
| FUEL SYSTEM | 0.6Very Low | —None |
| FORWARD COLLISION AVOIDANCE | 0.5Very Low | —None |
| FUEL/PROPULSION SYSTEM | 0.5Very Low | —None |
| STEERING | 0.5Very Low | —None |
| AIR BAGS | 0.3Very Low | 0.1Very Low |
| SUSPENSION | 0.3Very Low | —None |
| VEHICLE SPEED CONTROL | 0.1Very Low | —None |
| STRUCTURE | 0.1Very Low | —None |
| SEAT BELTS | 0.1Very Low | —None |
| TIRES | —None | —None |
| EXTERIOR LIGHTING | —None | —None |
| BACK OVER PREVENTION | —None | —None |
| VISIBILITY | —None | —None |
| WHEELS | —None | —None |
Complaints per 10,000 units sold, aggregated across all tracked model years from NHTSA owner reports.
Which Is Cheaper to Maintain: Acura TLX or BMW 3 Series?
How Does Acura TLX vs BMW 3 Series Reliability Compare by Year?
| Year | Acura TLX | BMW 3 Series | Edge |
|---|---|---|---|
| 2025 | 80/1001R / 3C | 71/1001R / 1C | Acura TLX |
| 2024 | 80/1001R / 4C | 71/1002R / 8C | Acura TLX |
| 2023 | 79/1002R / 13C | 70/1004R / 9C | Acura TLX |
| 2022 | 75/1003R / 26C | 70/1003R / 6C | Acura TLX |
| 2021 | 71/1003R / 79C | 67/1009R / 22C | Acura TLX |
| 2020 | 71/1004R / 59C | 64/10012R / 45C | Acura TLX |
| 2019 | 69/1005R / 87C | 66/1009R / 34C | Acura TLX |
| 2018 | 71/1003R / 90C | 65/1005R / 58C | Acura TLX |
Best years to cross-shop: The 2024 Acura TLX scored 80/100 and the 2024 BMW 3 Series scored 71/100 — the strongest shared model years that have been on the road for at least two years, where available.
Who Should Buy the Acura TLX vs the BMW 3 Series?
Acura TLX vs BMW 3 Series: Common Questions
- Is the Acura TLX more reliable than the BMW 3-Series?
- Yes, the TLX has a clear edge. Its estimated annual repair cost is lower, it averages 0.2 unscheduled shop visits a year against 1 for the BMW, and its repairs are less often major. Its main weakness is connecting rod failure, which can ruin an engine.
- Which has more recalls, the TLX or the 3-Series?
- The 3-Series has more. Federal recall records show 45 across nine model years for the BMW and 22 across eight for the Acura. Many BMW owners also say dealers lack parts for the starter recall, so the repair can sit unfinished for a long time.
- Which costs less to repair?
- The TLX costs less. Independent repair-cost data estimates $440 a year for the Acura and $773 for the BMW. Over five years, that leaves you about $1,665 ahead with the TLX, and a repair is half as likely to be major.
- What is the biggest problem with the Acura TLX?
- Connecting rod failure. Owners describe ticking or knocking that grows louder until the engine seizes, loses power, or stalls on the highway. Dealers often replace the whole engine, and some owners wait on backordered recall parts. One out-of-warranty repair was quoted at $20k.
- Is the BMW 3-Series safe to buy used?
- It can be, with checks. Its air bag area has five crash-linked complaints, and the Acura has none there. Owners report restraint warnings with no prior damage, and one car caught fire while driven. Confirm the starter recall is complete and no restraint warning is showing.
Related Reliability Comparisons
More Acura TLX comparisons
Decided between Acura TLX and BMW 3 Series? Run a VIN check before you buy — uncover hidden accidents, title issues, and open recalls.
How we score the Acura TLX and BMW 3 Series
Scores weight complaint severity at 35%, repair costs at 30%, recall impact at 20%, and the spread of complaints across systems at 15%, with complaint counts adjusted for US sales. Read the full methodology.
See incorrect data? Report an issue