Last updated: 2026-11-20
Hyundai Tucson vs Kia Sportage: Reliability Compared
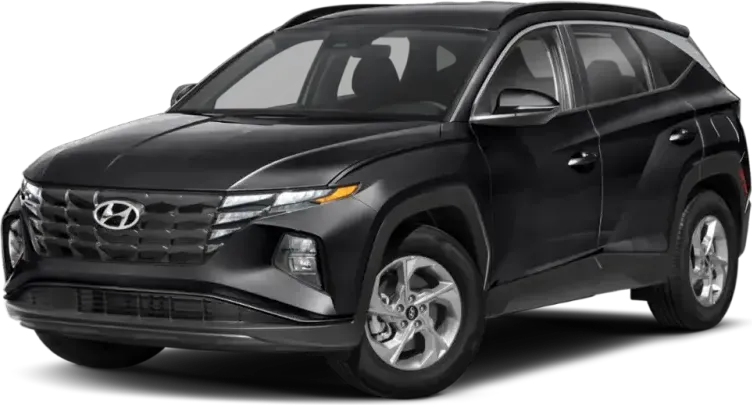 Hyundai Tucson
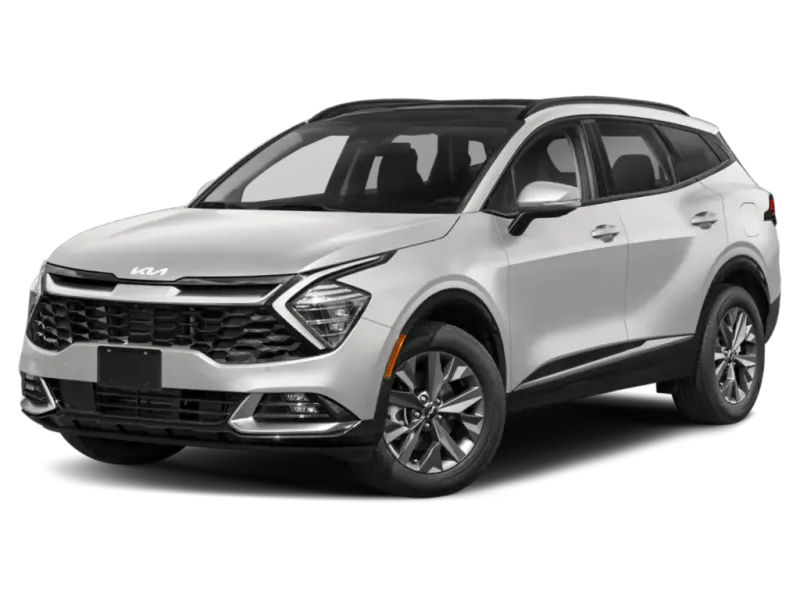 Kia Sportage
Dead even: 3 rounds each, 1 drawn
Reliability favors the Kia Sportage slightly over the Hyundai Tucson. Owners filed far fewer complaints per vehicle sold. Both rate good, and the Tucson is cheaper to repair with fewer recalls, so the gap is slim. Here is how problems, costs, and model years compare.
How Do the Hyundai Tucson and Kia Sportage Generations Compare?
Verdict
The Kia Sportage is more reliable than the Hyundai Tucson, scoring 74/100 vs 72/100.
A slight edge goes to the Sportage, and the deciding reason is its cleaner complaint record. Owners filed about half as many complaints per vehicle sold, and its shop visits are a little less frequent. The Tucson answers with lower repair costs and fewer recalls. Both stand as good used buys. Treat the gap as a tiebreaker, not a reason to rule out the Tucson. The Sportage's lead rests on fewer complaints, not on cheaper ownership.
Biggest gaps
- Kia Sportage has 5.1 fewer complaints per 10k sold
- Kia Sportage needs 0.1 fewer repairs per year
- Hyundai Tucson has 5 fewer total recalls
Round by round
- Reliability ScoreSportage
- Total RecallsTucson
- Complaint RateSportage
- Annual Repair CostTucson
- Repair FrequencySportage
- Major Repair RiskTucson
- Safety RatingDraw
Leaning Hyundai Tucson or Kia Sportage? Check the exact car before you buy
Whichever wins on paper, the car in front of you has its own past. A VIN check shows its accidents, title history and any open recalls.
Hyundai Tucson vs Kia Sportage: Which Is More Reliable?
| Metric | Hyundai Tucson | Kia Sportage |
|---|---|---|
| Reliability ScoreOut of 100, higher is better | 72/100 | 74/100 |
| Years Tracked | 9 | 9 |
| Total RecallsLower is better | 23 | 28 |
| Complaints per 10k SoldLower is better | 12 | 6.9 |
| Annual Repair CostLower is better | $426/yr | $462/yr |
| Repair FrequencyUnscheduled shop visits a year | 0.3/yr | 0.2/yr |
| Major Repair RiskChance a repair is major | 10% | 11% |
| Safety RatingNHTSA overall | 2026 NHTSA | 2026 NHTSA |
| Frontal | ||
| Side | ||
| Rollover | ||
| Year WinsModel years with the higher score | 3 (1 tied) | 5 (1 tied) |
What Are the Common Problems With the Hyundai Tucson and Kia Sportage?
Crash-linked complaints separate the two. The Tucson has far more of them in brakes and automatic emergency braking, where the car stops hard with no hazard and gets rear-ended. Hybrids also lose power at freeway speed, and the instrument cluster can go black with "No Signal." The Sportage's worst reports differ: heavy oil consumption ending in engine failure, power loss with fires, and cruise control jumping to 110 mph. That last area, vehicle speed control, has crash-linked complaints on the Sportage and no counterpart among the Tucson's main problems. Sportage oil problems cluster at high mileage, while many Tucson faults appear early.
| Hyundai Tucson | Problem area | Kia Sportage |
|---|---|---|
3.2 | Engine | 1.9 |
1.3 | Electrical | 1.0 |
1.6 | Brakes | 0.6 |
1.1 | Automatic emergency braking | 0.2 |
0.8 | Transmission | 0.2 |
0.6 | Fuel system | 0.1 |
0.3 | Acceleration and cruise control | 0.3 |
0.2 | Airbags | 0.1 |
0.1 | Body and structure | 0.2 |
<0.1 | Steering | 0.1 |
0.1 | Headlights and exterior lights | <0.1 |
0 | Wipers and visibility | 0.1 |
<0.1 | Trailer hitches | <0.1 |
<0.1 | Seats | <0.1 |
<0.1 | Seat belts | 0 |
<0.1 | Lane keeping | <0.1 |
<0.1 | Backup camera | 0 |
1.2 | Other or unspecified | 1.0 |
Complaints per 10,000 units sold, aggregated across all tracked model years from NHTSA owner reports. Shorter bars mean fewer complaints.
Hyundai Tucson problem guides
Kia Sportage problem guides
Which Is Cheaper to Maintain: Hyundai Tucson or Kia Sportage?
How Does Hyundai Tucson vs Kia Sportage Reliability Compare by Year?
| Year | Hyundai Tucson | Kia Sportage | Edge |
|---|---|---|---|
| 2026 | 80/1004 recalls · 104 complaints | 83/1003 recalls · 47 complaints | Sportage+3 |
| 2025 | 71/1006 recalls · 460 complaints | 81/1002 recalls · 77 complaints | Sportage+10 |
| 2024 | 73/1004 recalls · 159 complaints | 77/1004 recalls · 112 complaints | Sportage+4 |
| 2023 | 73/1002 recalls · 184 complaints | 66/1009 recalls · 316 complaints | Tucson+7 |
| 2022 | 65/1003 recalls · 512 complaints | 78/1001 recall · 47 complaints | Sportage+13 |
| 2021 | 76/1001 recall · 85 complaints | 75/1002 recalls · 54 complaints | Tucson+1 |
| 2020 | 72/1001 recall · 180 complaints | 67/1002 recalls · 172 complaints | Tucson+5 |
| 2019 | 67/1001 recall · 387 complaints | 73/1002 recalls · 72 complaints | Sportage+6 |
| 2018 | 67/1001 recall · 399 complaints | 67/1003 recalls · 166 complaints | Tie |
Best years to cross-shop: The 2021 Hyundai Tucson scored 76/100 and the 2022 Kia Sportage scored 78/100, the strongest shared model years that have been on the road for at least two years, where available.
Who Should Buy the Hyundai Tucson vs the Kia Sportage?
Team SportageChoose the Sportage if you want the lower complaint rate and fewer reports of cars braking on their own. Its big engine risk is oil use between 100,000 and 150,000 miles, so ask for oil records and check the level on any high-mileage example. Skip 2023 and 2018, its weakest years. Its strongest years, 2026 and 2025, are recent and have had little time to collect complaints, so do not read them as proven.
Team TucsonChoose the Tucson if lower yearly repair cost and fewer recalls matter more to you. Look at 2021 first, and avoid 2022 and 2019, its weakest years. If you are considering a hybrid or plug-in hybrid, drive it at freeway speed, because several owners report power loss there. On either car, confirm the instrument screen and cameras work, and ask whether any recall work is still open.
Hyundai Tucson vs Kia Sportage: Common Questions
- Is the Hyundai Tucson more reliable than the Kia Sportage?
- No, the Sportage has a slight edge. Both stand as good, but owners filed 6.9 complaints per 10,000 Sportages sold against 12 for the Tucson. The Sportage also averages fewer unscheduled shop visits. The Tucson offsets that with lower repair costs, so the difference is small.
- Which has more recalls, the Tucson or the Sportage?
- The Sportage has more. Federal recall records show 28 recalls across 9 model years for the Sportage and 23 for the Tucson. More recalls do not by themselves mean a worse car. Before buying, confirm any recall work on the specific vehicle has been completed.
- Which is cheaper to repair, the Tucson or the Sportage?
- The Tucson is cheaper. Independent repair-cost data estimates $426 a year for the Tucson and $462 for the Sportage, roughly $180 more over five years. The Sportage makes up some ground by needing unscheduled shop visits less often, 0.2 a year against 0.3.
- Do Kia Sportage engines burn oil?
- Oil consumption is the leading engine complaint on the Sportage. Owners describe losing a quart every few hundred miles with no visible leak, often with no dash warning. Reports cluster between 100,000 and 150,000 miles, and some end in engine failure. Check oil records and level on any used example.
- What are the common Hyundai Tucson problems?
- Engine and brake faults lead the Tucson's complaints. Hybrids lose power with a hybrid system warning, and brakes can apply hard with no obstacle ahead. Automatic emergency braking can also fire without a hazard, and the instrument cluster can go black. Brake and collision avoidance complaints include many crashes.
Related Reliability Comparisons
More Hyundai Tucson comparisons
Decided between Hyundai Tucson and Kia Sportage? Run a VIN check before you buy — uncover hidden accidents, title issues, and open recalls.
How we score the Hyundai Tucson and Kia Sportage
Scores weight complaint severity at 35%, repair costs at 30%, recall impact at 20%, and the spread of complaints across systems at 15%, with complaint counts adjusted for US sales. Read the full methodology.
See incorrect data? Report an issue