Last updated: 2026-10-10
Hyundai Santa Fe vs Toyota 4Runner: Reliability Compared
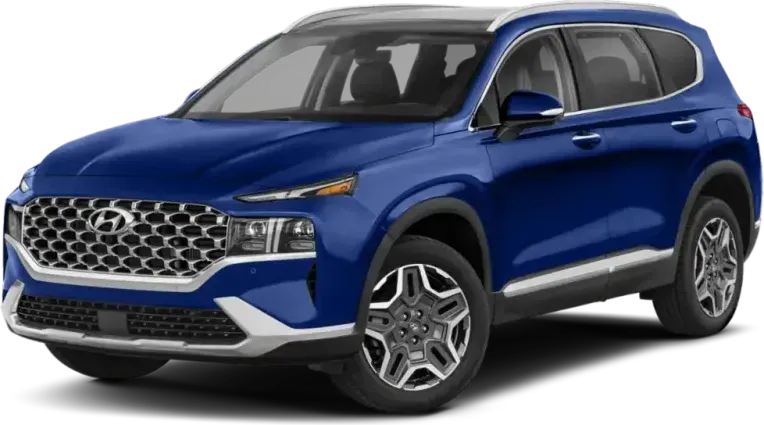
Hyundai Santa Fe

Toyota 4Runner
On reliability, the Toyota 4RUNNER beats the Hyundai Santa-FE by a wide margin. Owners filed far fewer complaints per vehicle sold. Repair costs are nearly identical, so complaint rates and recalls decide it.
How Do the Hyundai Santa Fe and Toyota 4Runner Generations Compare?
Verdict
The Toyota 4Runner is more reliable than the Hyundai Santa Fe, scoring 80/100 vs 70/100.
Reliability favors the Toyota 4Runner, and the gap is large. Owners filed far fewer complaints per vehicle sold, and federal recall records show far fewer recalls. The Santa Fe holds a good standing, but heavy oil burning and brake and acceleration failures pull it down. Repair bills are about the same for both, so the edge comes from how often and how badly the Santa Fe goes wrong, not from what a shop charges.
Key Differences
- 1Toyota 4Runner has 43 fewer total recalls
- 2Toyota 4Runner scores 10 points higher in reliability
- 3Toyota 4Runner has 6.5 fewer complaints per 10k sold
Category Scoreboard
Hyundai Santa Fe vs Toyota 4Runner: Which Is More Reliable?
| Metric | Hyundai Santa Fe | Toyota 4Runner |
|---|---|---|
| Reliability Score | 70/100 | 80/100 |
| Years Tracked | 9 | 9 |
| Total Recalls | 60 | 17 |
| Complaints per 10k Sold | 8 | 1.5 |
| Annual Repair Cost | $515/yr | $514/yr |
| Repair Frequency | 0.2/yr | 0.4/yr |
| Major Repair Risk | 10% | 13% |
| Year Wins | 0 | 9 |
What Are the Common Problems With the Hyundai Santa Fe and Toyota 4Runner?
Oil burning is the Santa Fe's biggest pattern. Owners find the engine several quarts low with no leak, then report shuddering, knocking, stalling and some engine failures. The 4Runner's top complaint is a shake through the steering wheel at 50 to 70 mph that shops often cannot cure. Crash links differ sharply. The Santa Fe has them in brakes that fail to stop the car, sudden acceleration while parking, and power train failures. The 4Runner's main crash-linked cluster is airbags that did not deploy in serious collisions.
| Component | Hyundai Santa Fe | Toyota 4Runner |
|---|---|---|
| ENGINE | 1.5Low | —None |
| UNKNOWN OR OTHER | 1.2Low | 0.2Very Low |
| POWER TRAIN | 1.3Low | —None |
| ELECTRICAL SYSTEM | 0.9Very Low | 0.1Very Low |
| SERVICE BRAKES | 0.5Very Low | 0.2Very Low |
| STEERING | 0.1Very Low | 0.2Very Low |
| VEHICLE SPEED CONTROL | 0.3Very Low | —None |
| FORWARD COLLISION AVOIDANCE | 0.2Very Low | —None |
| AIR BAGS | 0.1Very Low | 0.1Very Low |
| STRUCTURE | 0.1Very Low | 0.1Very Low |
| VISIBILITY/WIPER | 0.1Very Low | —None |
| VISIBILITY | 0.1Very Low | —None |
| SEAT BELTS | 0.1Very Low | —None |
| FUEL/PROPULSION SYSTEM | 0.1Very Low | —None |
| ENGINE AND ENGINE COOLING | 0.1Very Low | —None |
| SUSPENSION | —None | 0.1Very Low |
| FUEL SYSTEM | —None | 0.1Very Low |
| EXTERIOR LIGHTING | —None | —None |
| TIRES | —None | —None |
| BACK OVER PREVENTION | —None | —None |
| TRAILER HITCHES | —None | —None |
Complaints per 10,000 units sold, aggregated across all tracked model years from NHTSA owner reports.
Which Is Cheaper to Maintain: Hyundai Santa Fe or Toyota 4Runner?
How Does Hyundai Santa Fe vs Toyota 4Runner Reliability Compare by Year?
| Year | Hyundai Santa Fe | Toyota 4Runner | Edge |
|---|---|---|---|
| 2026 | 75/1005R / 5C | 84/1000R / 0C | Toyota 4Runner |
| 2025 | 75/1006R / 109C | 81/1001R / 36C | Toyota 4Runner |
| 2024 | 73/1009R / 109C | 79/1001R / 8C | Toyota 4Runner |
| 2023 | 70/1004R / 244C | 82/1001R / 28C | Toyota 4Runner |
| 2022 | 66/10014R / 223C | 79/1003R / 36C | Toyota 4Runner |
| 2021 | 69/10010R / 165C | 82/1001R / 31C | Toyota 4Runner |
| 2020 | 70/1002R / 165C | 82/1001R / 30C | Toyota 4Runner |
| 2019 | 69/1003R / 201C | 77/1004R / 61C | Toyota 4Runner |
| 2018 | 63/1007R / 489C | 77/1005R / 56C | Toyota 4Runner |
Best years to cross-shop: The 2024 Hyundai Santa Fe scored 73/100 and the 2023 Toyota 4Runner scored 82/100 — the strongest shared model years that have been on the road for at least two years, where available.
Who Should Buy the Hyundai Santa Fe vs the Toyota 4Runner?
Hyundai Santa Fe vs Toyota 4Runner: Common Questions
- Is the Toyota 4RUNNER more reliable than the Hyundai Santa-FE?
- Yes, by a large gap. The 4Runner has an excellent standing and the Santa Fe a good one. Owners filed 286 complaints on the 4Runner and 1,710 on the Santa Fe, and the rate per vehicle sold is much lower for the Toyota.
- Which has more recalls, the 4Runner or the Santa Fe?
- The Santa Fe has far more. Federal recall records show 60 recalls across nine model years for the Santa Fe and 17 for the 4Runner. Check any used example by VIN to confirm recall work was completed.
- Which costs less to repair?
- They cost about the same. Estimated annual repair cost is $514 for the 4Runner and $515 for the Santa Fe. The Santa Fe has fewer unscheduled shop visits, 0.2 a year against 0.4, and a lower 10% chance of a major repair versus 13%.
- Do Hyundai Santa Fe engines burn oil?
- Many owner complaints say so. The engine is the Santa Fe's top problem area, with owners finding the engine several quarts low and no leak, often around 78,788 to 110,000 miles. Left alone, it can lead to knocking, stalling and engine failure.
- What is the most common 4Runner problem?
- Steering shake is the most common. Drivers feel shaking through the wheel at highway speed, usually between 50 and 70 mph. Balancing, new tires and alignment checks often do not fix it. Brake squeak on cold mornings is the next most reported issue.
Related Reliability Comparisons
More Hyundai Santa Fe comparisons
Decided between Hyundai Santa Fe and Toyota 4Runner? Run a VIN check before you buy — uncover hidden accidents, title issues, and open recalls.
How we score the Hyundai Santa Fe and Toyota 4Runner
Scores weight complaint severity at 35%, repair costs at 30%, recall impact at 20%, and the spread of complaints across systems at 15%, with complaint counts adjusted for US sales. Read the full methodology.
See incorrect data? Report an issue