Last updated: 2026-10-10
Land Rover Defender 110 vs Toyota 4Runner: Reliability Compared
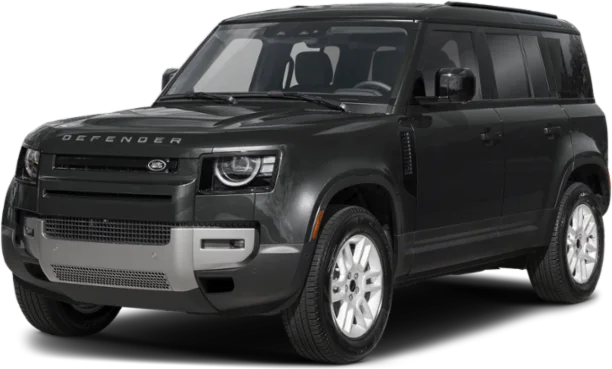
Land Rover Defender 110

Toyota 4Runner
In this matchup, the Toyota 4RUNNER comes out well ahead of the Land Rover Defender 110 on reliability. The deciding fact is the Defender's DC/DC converter, which can cut power and steering, and which owners say failed again after replacement. The 4Runner draws far fewer complaints per vehicle sold.
How Do the Land Rover Defender 110 and Toyota 4Runner Generations Compare?
Verdict
The Toyota 4Runner is more reliable than the Land Rover Defender 110, scoring 80/100 vs 60/100.
Reliability clearly favors the Toyota, and the gap is large. Owners file far fewer complaints per vehicle sold: 1.5 per 10,000 against 20.7 for the Defender. The deciding issue is how the Defender fails. A faulty DC/DC converter can cut power, steering and brakes, and owners say replacement converters failed again. The 4Runner has real faults too, including stalling and airbag non-deployment reports, but its complaints are spread across several systems instead of piling up around one repeat failure.
Key Differences
- 1Toyota 4Runner scores 20 points higher in reliability
- 2Toyota 4Runner has 19.2 fewer complaints per 10k sold
- 3Toyota 4Runner has 6 fewer total recalls
Category Scoreboard
Land Rover Defender 110 vs Toyota 4Runner: Which Is More Reliable?
| Metric | Land Rover Defender 110 | Toyota 4Runner |
|---|---|---|
| Reliability Score | 60/100 | 80/100 |
| Years Tracked | 6 | 9 |
| Total Recalls | 23 | 17 |
| Complaints per 10k Sold | 20.7 | 1.5 |
| Year Wins | 0 | 6 |
What Are the Common Problems With the Land Rover Defender 110 and Toyota 4Runner?
The Defender's trouble centers on electrical power. The DC/DC converter stops charging the 12-volt battery, an "Electrical fault detected" message appears, and the vehicle can lose steering, stall in traffic or refuse to shift into Neutral. Cracked windshields and burned-out LED daytime running lights add costly, non-mechanical complaints. The 4Runner's most common report is a steering wheel shake at 50 to 70 mph that tire work does not cure, plus brake squeal and rodent-chewed wiring. Airbags are its most serious crash-linked area: 20 of 24 complaints involve crashes, mostly front airbags that did not deploy. The Defender has no comparable crash-linked cluster.
| Component | Land Rover Defender 110 | Toyota 4Runner |
|---|---|---|
| ELECTRICAL SYSTEM | 6.5Average | 0.1Very Low |
| VISIBILITY/WIPER | 4.3Average | —None |
| STEERING | 1.8Low | 0.2Very Low |
| EXTERIOR LIGHTING | 1.7Low | —None |
| UNKNOWN OR OTHER | 1.3Low | 0.2Very Low |
| POWER TRAIN | 1.1Low | —None |
| ENGINE | 0.6Very Low | —None |
| STRUCTURE | 0.4Very Low | 0.1Very Low |
| BACK OVER PREVENTION | 0.2Very Low | —None |
| SERVICE BRAKES | —None | 0.2Very Low |
| AIR BAGS | —None | 0.1Very Low |
| SUSPENSION | —None | 0.1Very Low |
| FUEL SYSTEM | —None | 0.1Very Low |
| FUEL/PROPULSION SYSTEM | —None | —None |
| SEAT BELTS | —None | —None |
| TIRES | —None | —None |
| VEHICLE SPEED CONTROL | —None | —None |
| VISIBILITY | —None | —None |
Complaints per 10,000 units sold, aggregated across all tracked model years from NHTSA owner reports.
How Does Land Rover Defender 110 vs Toyota 4Runner Reliability Compare by Year?
| Year | Land Rover Defender 110 | Toyota 4Runner | Edge |
|---|---|---|---|
| 2026 | 64/1000R / 0C | 84/1000R / 0C | Toyota 4Runner |
| 2025 | 59/1001R / 8C | 81/1001R / 36C | Toyota 4Runner |
| 2024 | 64/1004R / 16C | 79/1001R / 8C | Toyota 4Runner |
| 2023 | 57/1007R / 70C | 82/1001R / 28C | Toyota 4Runner |
| 2022 | 59/1004R / 61C | 79/1003R / 36C | Toyota 4Runner |
| 2021 | 59/1007R / 32C | 82/1001R / 31C | Toyota 4Runner |
Best years to cross-shop: The 2024 Land Rover Defender 110 scored 64/100 and the 2023 Toyota 4Runner scored 82/100 — the strongest shared model years that have been on the road for at least two years, where available.
Who Should Buy the Land Rover Defender 110 vs the Toyota 4Runner?
Land Rover Defender 110 vs Toyota 4Runner: Common Questions
- Is the Toyota 4RUNNER more reliable than the Land Rover Defender 110?
- Yes, by a large margin. The 4Runner rates excellent and the Defender rates good. Owners report 1.5 complaints per 10,000 4Runners sold against 20.7 for the Defender. The Defender's repeat converter failures, which can cause power loss while driving, are the biggest reason for the gap.
- Which has more recalls, the 4RUNNER or the Defender 110?
- The Defender has more. Federal recall records show 23 recalls across its 6 model years, against 17 across 9 model years for the 4Runner. The Defender packs more recalls into fewer model years.
- What is the most serious Defender 110 problem?
- A failing 48v to 12v DC/DC converter is the most serious. The dash warns of an electrical fault, then power can fail completely. Owners describe locked brakes, no steering, stalls in a travel lane and a vehicle that needs a tow. Some replacement converters failed again.
- Does the 4RUNNER have safety problems I should check?
- Yes. Airbag complaints are the most serious, with 20 of 24 linked to crashes, mostly front airbags that did not deploy. Also check for steering wheel shake at highway speed, which drivers say tire work does not fix, and for stalling or rodent-damaged wiring.
- Which model years of the 4RUNNER and Defender 110 should I avoid?
- For the 4Runner, avoid 2018 and 2019, its weakest years. For the Defender, avoid 2023 and 2021. The best years are 2021 and 2026 for the 4Runner, and 2024 and 2026 for the Defender, though newer years have had less time to collect complaints.
Related Reliability Comparisons
More Land Rover Defender 110 comparisons
Decided between Land Rover Defender 110 and Toyota 4Runner? Run a VIN check before you buy — uncover hidden accidents, title issues, and open recalls.
How we score the Land Rover Defender 110 and Toyota 4Runner
Scores weight complaint severity at 35%, repair costs at 30%, recall impact at 20%, and the spread of complaints across systems at 15%, with complaint counts adjusted for US sales. Read the full methodology.
See incorrect data? Report an issue