Last updated: 2026-10-10
Ram ProMaster vs Toyota Tundra: Reliability Compared
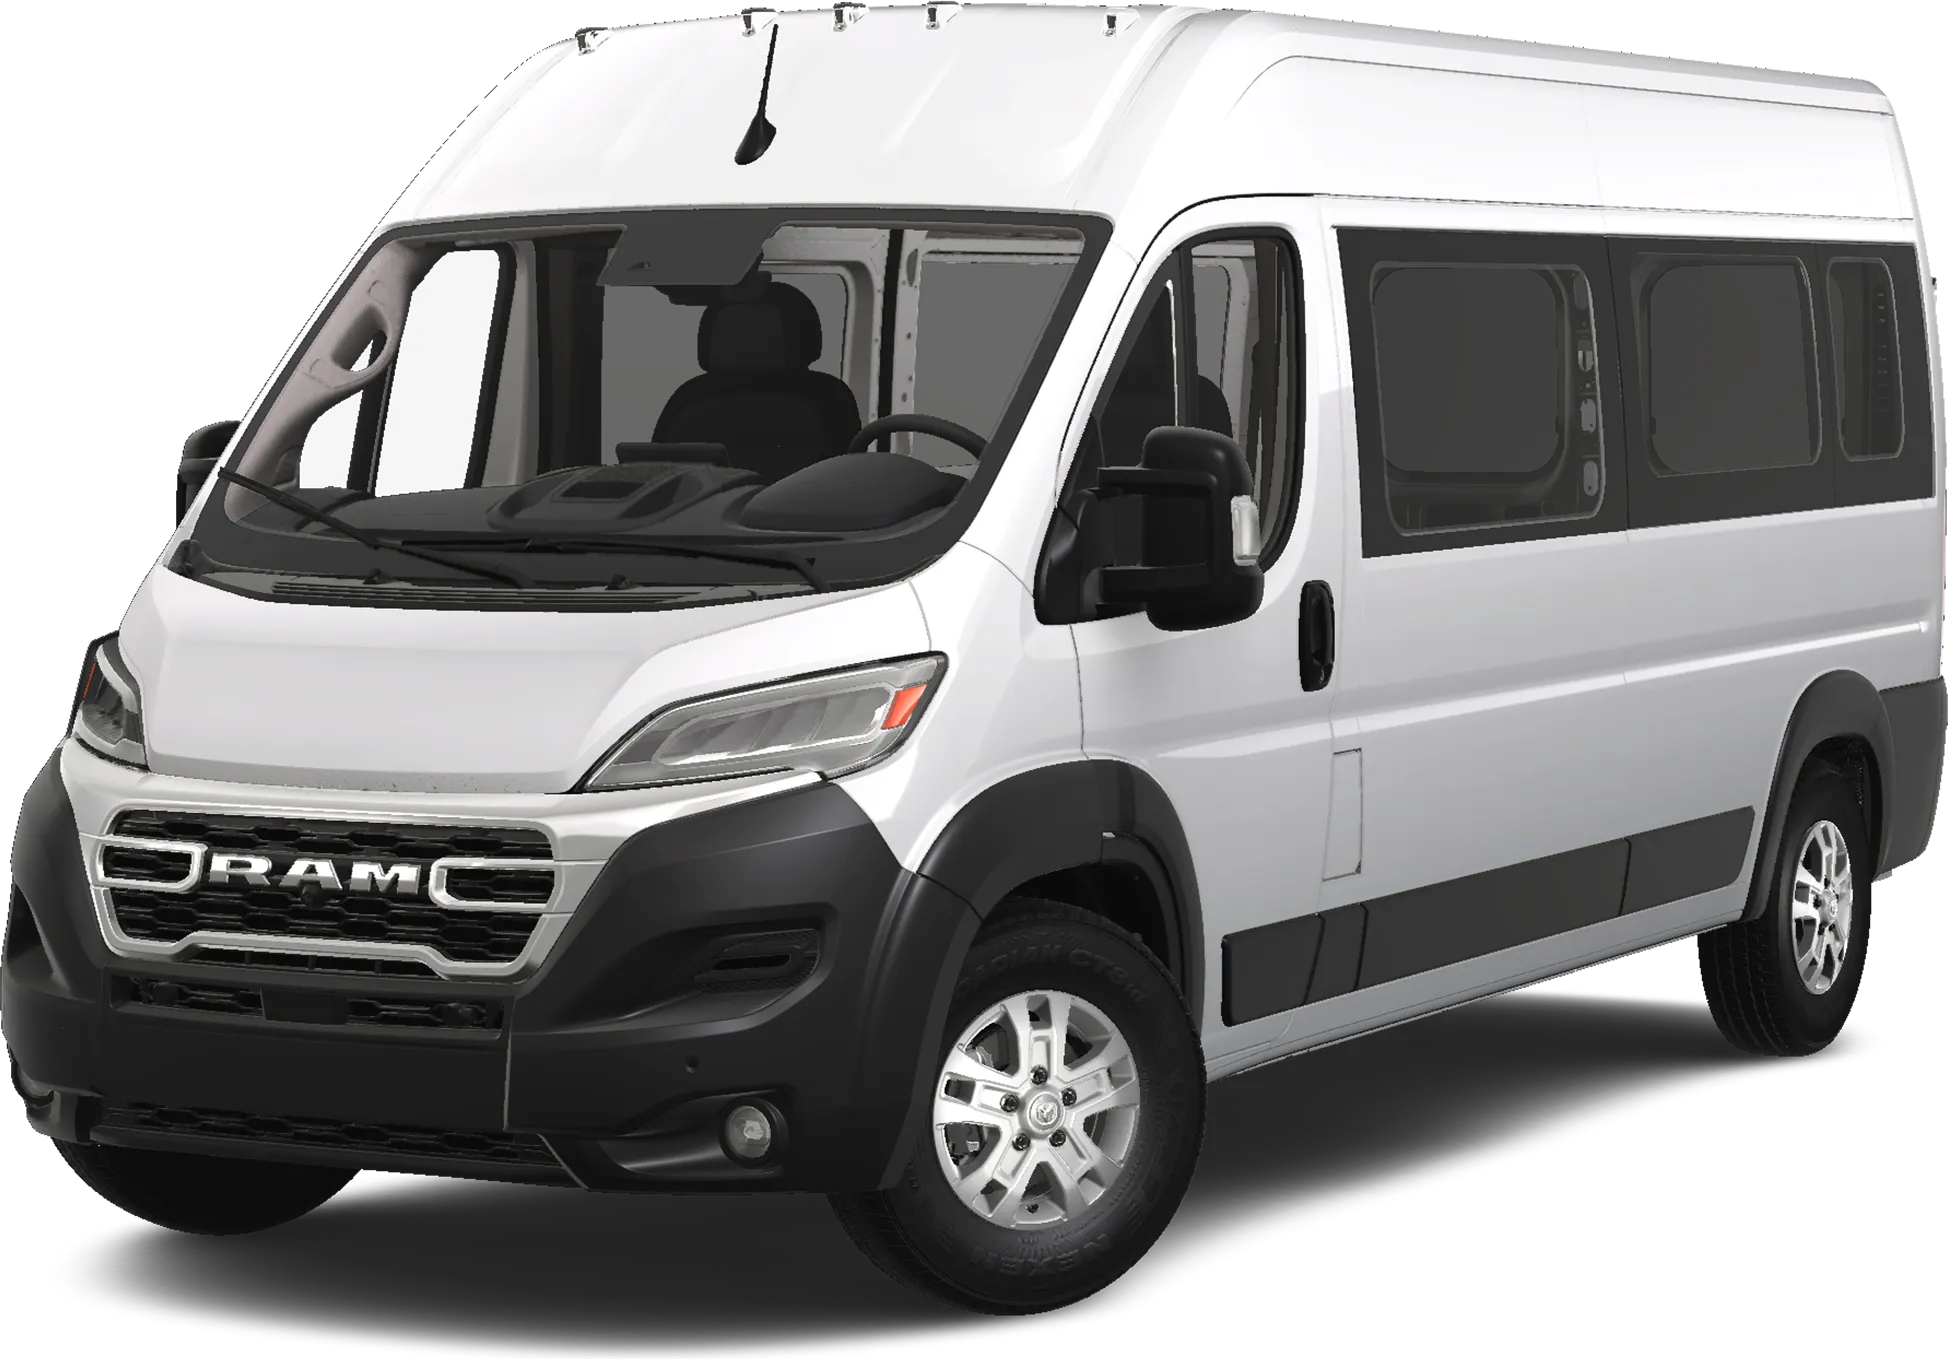
Ram ProMaster

Toyota Tundra
Shoppers choosing between the Toyota Tundra and the Ram Promaster will find a clear edge for the Tundra. It has low shop-visit numbers and one main fault, while Promaster owners report sudden stalls, steering loss, and long waits for recall parts.
How Do the Ram ProMaster and Toyota Tundra Generations Compare?
Verdict
The Toyota Tundra is more reliable than the Ram ProMaster, scoring 69/100 vs 62/100.
A clear edge goes to the Tundra. Owners report few unscheduled shop visits, and most of its complaints trace back to one repeatable fault: throttle hesitation from a stop. The Promaster draws fewer complaints per vehicle sold, but its reports include sudden stalls, lost power steering, and brake actuator failures, often with repair parts backordered. The Tundra has more complaints and more recalls, so it is not trouble free. Still, one known problem beats several serious ones with long waits for fixes.
Key Differences
- 1Ram ProMaster has 36 fewer total recalls
- 2Ram ProMaster has 7.3 fewer complaints per 10k sold
- 3Toyota Tundra scores 7 points higher in reliability
Category Scoreboard
Ram ProMaster vs Toyota Tundra: Which Is More Reliable?
| Metric | Ram ProMaster | Toyota Tundra |
|---|---|---|
| Reliability Score | 62/100 | 69/100 |
| Years Tracked | 9 | 9 |
| Total Recalls | 54 | 90 |
| Complaints per 10k Sold | 4.6 | 11.9 |
| Year Wins | 2 | 7 |
What Are the Common Problems With the Ram ProMaster and Toyota Tundra?
Throttle lag runs through almost every Tundra problem area. Drivers press the pedal at a stop, wait one to three seconds, then feel a lurch. A few engines died while driving, and one report cites a failed bearing. Promaster complaints are more varied: the engine and dash shutting off with no warning, power steering locking up after water reaches the wiring, transmissions thumping or downshifting hard, and brake pedals sinking. Crash-linked reports appear in three Tundra areas, including electrical. The Promaster has them in power train, engine, and service brakes, but none in electrical or steering.
| Component | Ram ProMaster | Toyota Tundra |
|---|---|---|
| POWER TRAIN | 0.5Very Low | 2.3Low |
| ENGINE | 0.2Very Low | 2Low |
| ELECTRICAL SYSTEM | 0.6Very Low | 1.1Low |
| ENGINE AND ENGINE COOLING | 0.4Very Low | 0.7Very Low |
| SERVICE BRAKES | 0.3Very Low | 0.7Very Low |
| UNKNOWN OR OTHER | 0.4Very Low | 0.5Very Low |
| FUEL/PROPULSION SYSTEM | —None | 0.9Very Low |
| STEERING | 0.5Very Low | 0.3Very Low |
| VEHICLE SPEED CONTROL | 0.1Very Low | 0.7Very Low |
| FUEL SYSTEM | —None | 0.4Very Low |
| STRUCTURE | 0.1Very Low | 0.2Very Low |
| LANE DEPARTURE | 0.1Very Low | —None |
| BACK OVER PREVENTION | 0.1Very Low | —None |
| SEAT BELTS | 0.1Very Low | —None |
| FORWARD COLLISION AVOIDANCE | 0.1Very Low | —None |
| WHEELS | 0.1Very Low | —None |
| AIR BAGS | —None | 0.1Very Low |
| SEATS | —None | 0.1Very Low |
| ELECTRONIC STABILITY CONTROL (ESC) | —None | 0.1Very Low |
| EQUIPMENT | —None | —None |
| TIRES | —None | —None |
| EXTERIOR LIGHTING | —None | —None |
| SUSPENSION | —None | —None |
| VISIBILITY/WIPER | —None | —None |
Complaints per 10,000 units sold, aggregated across all tracked model years from NHTSA owner reports.
How Does Ram ProMaster vs Toyota Tundra Reliability Compare by Year?
| Year | Ram ProMaster | Toyota Tundra | Edge |
|---|---|---|---|
| 2026 | 65/1001R / 1C | 82/1000R / 0C | Toyota Tundra |
| 2025 | 62/1004R / 3C | 73/1006R / 88C | Toyota Tundra |
| 2024 | 62/1006R / 5C | 65/10014R / 235C | Toyota Tundra |
| 2023 | 63/1007R / 39C | 59/10022R / 321C | Ram ProMaster |
| 2022 | 61/1008R / 53C | 57/10021R / 386C | Ram ProMaster |
| 2021 | 58/10011R / 98C | 75/1003R / 23C | Toyota Tundra |
| 2020 | 62/1007R / 34C | 74/1005R / 42C | Toyota Tundra |
| 2019 | 58/10010R / 60C | 70/10010R / 69C | Toyota Tundra |
| 2018 | 68/1000R / 1C | 69/1009R / 94C | Toyota Tundra |
Best years to cross-shop: The 2018 Ram ProMaster scored 68/100 and the 2021 Toyota Tundra scored 75/100 — the strongest shared model years that have been on the road for at least two years, where available.
Who Should Buy the Ram ProMaster vs the Toyota Tundra?
Ram ProMaster vs Toyota Tundra: Common Questions
- Is the Toyota Tundra more reliable than the Ram Promaster?
- Yes, the Tundra has a clear edge. Owners report few unscheduled shop visits, and its complaints center on throttle hesitation from a stop. The Promaster has fewer complaints per vehicle sold, but they cover stalls, steering lockups, brake failures, and backordered parts.
- Which has more recalls, the Tundra or the Promaster?
- The Tundra has more. Federal recall records show 90 across its nine model years from 2018 to 2026, against 54 for the Promaster. Recall counts reflect how many campaigns were filed, not how long owners wait for a fix. Promaster owners describe long waits for parts.
- What is the biggest problem with the Toyota Tundra?
- Throttle hesitation from a stop. Drivers press the pedal and get no response for one to three seconds, then the truck surges. It appears in power train, engine, electrical, and fuel complaints, and owners describe near misses at intersections. A few engines also failed while driving.
- What goes wrong with the Ram Promaster?
- Electrical shutoffs, transmission faults, and steering and brake failures lead the list. Some vans lose engine and dash power with no warning. Shops often blame water in the steering wiring. Many repairs wait on backordered parts, and some owners report waiting more than a year for brake components.
- Which Tundra and Promaster years should I avoid?
- Avoid the 2022 and 2023 Tundra, its weakest years, and favor the 2021. For the Promaster, avoid 2019 and 2021, and look first at 2018. Check any open recalls on either van or truck before you buy.
Related Reliability Comparisons
More Ram ProMaster comparisons
Decided between Ram ProMaster and Toyota Tundra? Run a VIN check before you buy — uncover hidden accidents, title issues, and open recalls.
How we score the Ram ProMaster and Toyota Tundra
Scores weight complaint severity at 35%, repair costs at 30%, recall impact at 20%, and the spread of complaints across systems at 15%, with complaint counts adjusted for US sales. Read the full methodology.
See incorrect data? Report an issue