Last updated: 2026-10-10
Land Rover Range Rover Sport vs Volvo XC90: Reliability Compared

Land Rover Range Rover Sport
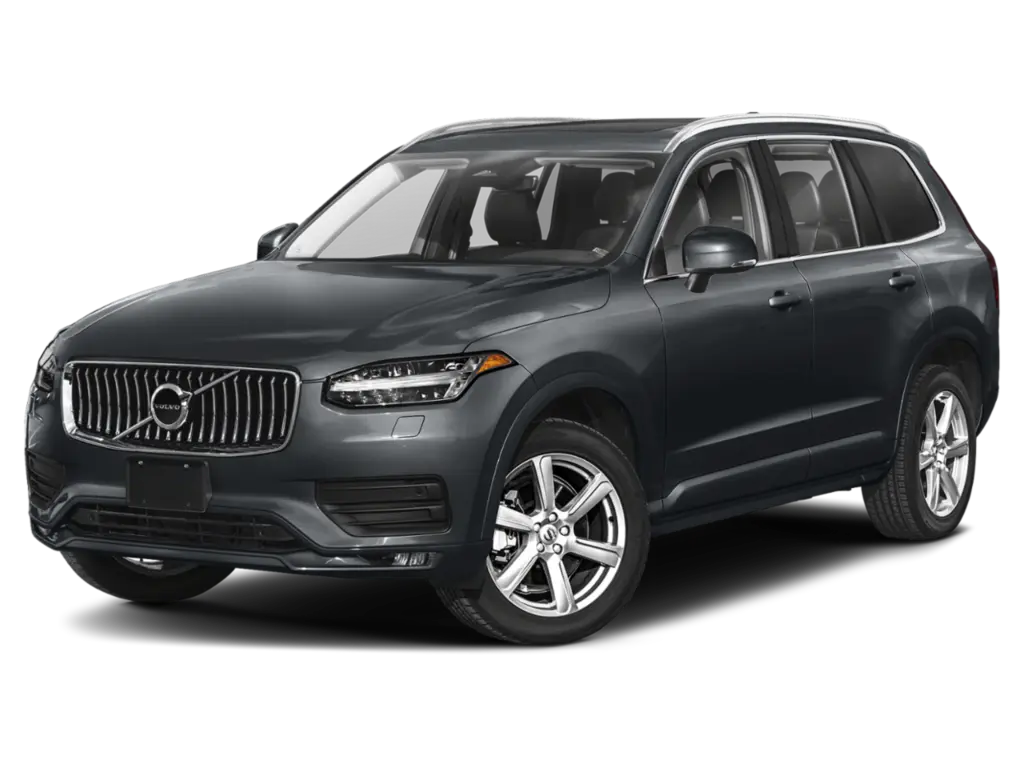
Volvo XC90
The Volvo XC90 is clearly more reliable than the Land Rover Range Rover Sport. Its owners file far fewer complaints per car sold. Federal recall records show 39 recalls for the Volvo and 177 for the Land Rover across model years 2018 to 2026.
How Do the Land Rover Range Rover Sport and Volvo XC90 Generations Compare?
Verdict
The Volvo XC90 is more reliable than the Land Rover Range Rover Sport, scoring 72/100 vs 57/100.
Reliability favors the Volvo by a wide margin. Owners filed far fewer complaints per vehicle sold, and federal recall records show 39 recalls against 177 for the Range Rover Sport. The Volvo's worst reports involve a dark instrument cluster and brake faults. The Land Rover has more problems in more areas, including splitting coolant pipes, power steering cutting out, and a dial shifter that lets the car leave park. The Volvo is not trouble-free, but the gap is large enough that it is the safer used buy.
Key Differences
- 1Volvo XC90 has 138 fewer total recalls
- 2Volvo XC90 has 52.2 fewer complaints per 10k sold
- 3Volvo XC90 scores 15 points higher in reliability
Category Scoreboard
Land Rover Range Rover Sport vs Volvo XC90: Which Is More Reliable?
| Metric | Land Rover Range Rover Sport | Volvo XC90 |
|---|---|---|
| Reliability Score | 57/100 | 72/100 |
| Years Tracked | 9 | 9 |
| Total Recalls | 177 | 39 |
| Complaints per 10k Sold | 56.4 | 4.2 |
| Year Wins | 1 | 8 |
What Are the Common Problems With the Land Rover Range Rover Sport and Volvo XC90?
The Volvo's complaints center on electronics and braking. The digital instrument cluster flickers or goes dark while driving, and some brake pedals lose stopping power without warning. The rear camera also drops out, and automatic reverse braking can slam on near curbs. The Land Rover's list is heavier on mechanical failures. Plastic coolant pipes split near the supercharger, often at highway speed, and several cases end in engine replacement. Power steering assist can cut out mid-turn. Its power train reports include cars leaving park on their own, with 10 crash-linked. Steering crashes show up only on the Land Rover. Brake-related crashes show up only on the Volvo.
| Component | Land Rover Range Rover Sport | Volvo XC90 |
|---|---|---|
| ELECTRICAL SYSTEM | 13.8Above Avg | 1.1Low |
| UNKNOWN OR OTHER | 6.6Average | 0.5Very Low |
| POWER TRAIN | 6.6Average | 0.2Very Low |
| ENGINE | 4.8Average | 0.2Very Low |
| VISIBILITY/WIPER | 4.1Average | 0.1Very Low |
| STEERING | 3.7Average | 0.1Very Low |
| STRUCTURE | 1.9Low | 0.1Very Low |
| AIR BAGS | 1.6Low | —None |
| EXTERIOR LIGHTING | 1.5Low | —None |
| SUSPENSION | 1.3Low | —None |
| SERVICE BRAKES | 0.7Very Low | 0.4Very Low |
| VEHICLE SPEED CONTROL | 0.7Very Low | —None |
| ENGINE AND ENGINE COOLING | 0.7Very Low | —None |
| LATCHES/LOCKS/LINKAGES | 0.4Very Low | 0.1Very Low |
| SEAT BELTS | 0.4Very Low | —None |
| VISIBILITY | 0.4Very Low | —None |
| BACK OVER PREVENTION | —None | 0.3Very Low |
| FUEL/PROPULSION SYSTEM | 0.1Very Low | 0.1Very Low |
| LANE DEPARTURE | 0.1Very Low | —None |
Complaints per 10,000 units sold, aggregated across all tracked model years from NHTSA owner reports.
How Does Land Rover Range Rover Sport vs Volvo XC90 Reliability Compare by Year?
| Year | Land Rover Range Rover Sport | Volvo XC90 | Edge |
|---|---|---|---|
| 2026 | 75/1003R / 0C | 73/1002R / 2C | Land Rover Range Rover Sport |
| 2025 | 68/1009R / 24C | 74/1003R / 23C | Volvo XC90 |
| 2024 | 64/10022R / 47C | 73/1003R / 26C | Volvo XC90 |
| 2023 | 52/10027R / 125C | 70/1006R / 39C | Volvo XC90 |
| 2022 | 53/10023R / 94C | 72/1004R / 27C | Volvo XC90 |
| 2021 | 53/10023R / 72C | 72/1005R / 17C | Volvo XC90 |
| 2020 | 42/10037R / 138C | 71/1007R / 24C | Volvo XC90 |
| 2019 | 56/10014R / 90C | 71/1006R / 31C | Volvo XC90 |
| 2018 | 47/10019R / 167C | 71/1003R / 40C | Volvo XC90 |
Best years to cross-shop: The 2024 Land Rover Range Rover Sport scored 64/100 and the 2024 Volvo XC90 scored 73/100 — the strongest shared model years that have been on the road for at least two years, where available.
Who Should Buy the Land Rover Range Rover Sport vs the Volvo XC90?
Land Rover Range Rover Sport vs Volvo XC90: Common Questions
- Is the Volvo XC90 more reliable than the Land Rover Range Rover Sport?
- Yes, by a large margin. The XC90 draws 4.2 owner complaints per 10,000 sold, against 56.4 for the Range Rover Sport. It also has far fewer recalls. The Volvo's reliability standing is good, while the Land Rover's is mixed.
- Which has more recalls, the XC90 or the Range Rover Sport?
- The Range Rover Sport has far more. Federal recall records list 177 recalls across model years 2018 to 2026, compared with 39 for the XC90 over the same span. That is more than four times as many for the Land Rover.
- What is the most common Range Rover Sport problem?
- Electrical faults lead, with 185 complaints. Screens freeze or go black, taking climate, radio, phone and backup camera controls with them. Engine coolant pipes that split near the supercharger are another repeated complaint, with failures reported between 42,651 and 69,908 miles.
- Does the Volvo XC90 have serious safety complaints?
- Yes, some. Owners report the brake pedal losing stopping power without warning, with 3 brake complaints linked to crashes. The instrument cluster can also go dark while driving, taking the speedometer and warnings with it. These are less frequent than the Land Rover's overall complaint volume.
- Can the Range Rover Sport roll away when parked?
- Owners have reported it. Power train complaints describe the car leaving park by itself and rolling or reversing while the driver door is open. One report involves a crash into a building with 2 injuries. If you test drive one, confirm the dial shifter holds park.
Related Reliability Comparisons
More Land Rover Range Rover Sport comparisons
Decided between Land Rover Range Rover Sport and Volvo XC90? Run a VIN check before you buy — uncover hidden accidents, title issues, and open recalls.
How we score the Land Rover Range Rover Sport and Volvo XC90
Scores weight complaint severity at 35%, repair costs at 30%, recall impact at 20%, and the spread of complaints across systems at 15%, with complaint counts adjusted for US sales. Read the full methodology.
See incorrect data? Report an issue