Last updated: 2026-10-10
Audi Q8 vs Land Rover Range Rover Sport: Reliability Compared
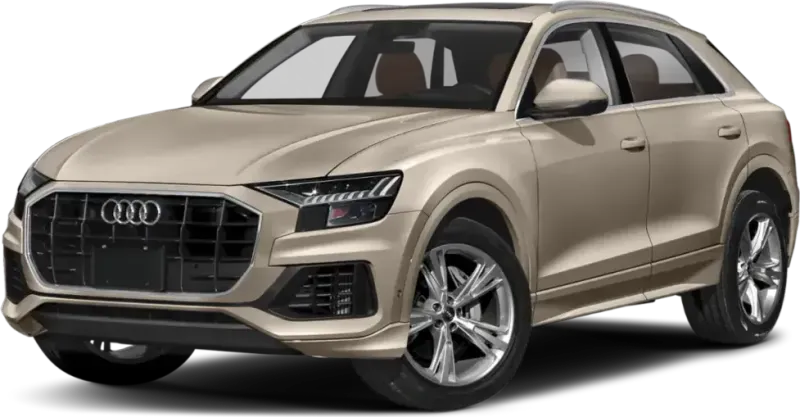
Audi Q8
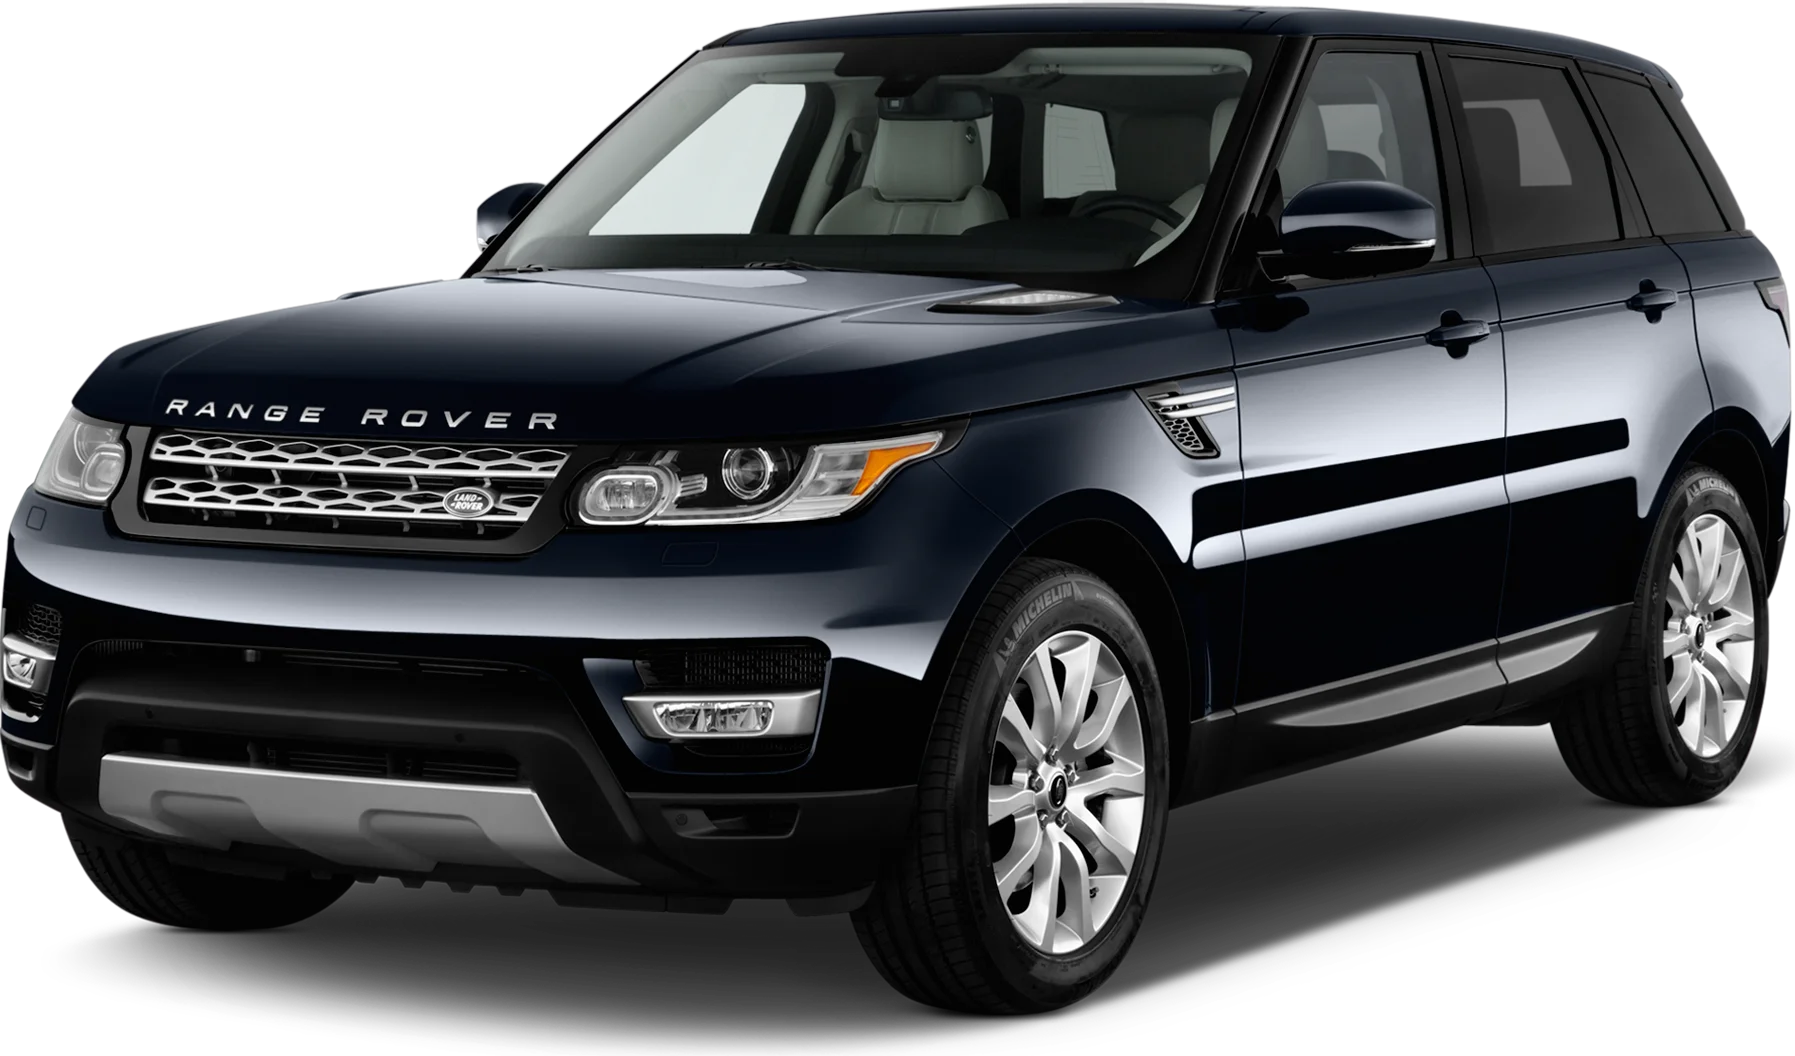
Land Rover Range Rover Sport
Reliability favors the Audi Q8 over the Land Rover Range Rover Sport, with far fewer complaints per car sold. The Q8 draws 21.4 complaints per 10,000 sold, against 56.4 for the Sport. Its main weak spot is alternator failure, while the Sport's coolant pipes and shifter draw more serious reports.
How Do the Audi Q8 and Land Rover Range Rover Sport Generations Compare?
Verdict
The Audi Q8 is more reliable than the Land Rover Range Rover Sport, scoring 64/100 vs 57/100.
On the record, the Q8 is the more reliable of the two, and the edge is clear. Owners filed 21.4 complaints per 10,000 sold, against 56.4 for the Range Rover Sport. Federal recall records show 43 recalls for the Q8 and 177 for the Sport. The Q8 has real faults, mainly alternator failures that can cut power while driving. The Sport's list is longer and more varied, with split coolant pipes, dial shifter problems and failing screens.
Key Differences
- 1Audi Q8 has 134 fewer total recalls
- 2Audi Q8 has 35.0 fewer complaints per 10k sold
- 3Audi Q8 scores 7 points higher in reliability
Category Scoreboard
Audi Q8 vs Land Rover Range Rover Sport: Which Is More Reliable?
| Metric | Audi Q8 | Land Rover Range Rover Sport |
|---|---|---|
| Reliability Score | 64/100 | 57/100 |
| Years Tracked | 8 | 9 |
| Total Recalls | 43 | 177 |
| Complaints per 10k Sold | 21.4 | 56.4 |
| Year Wins | 4 (1 tied) | 3 (1 tied) |
What Are the Common Problems With the Audi Q8 and Land Rover Range Rover Sport?
Electrical trouble defines the Q8. A failing alternator can trigger warnings, drop steering assist and leave the car stalled or towed, and replacement parts have been on back order. Water pump failures and 3.0L turbo engine failures also appear. The Sport's problems are spread wider. Coolant pipes split without warning, often at highway speed, and some cases end in engine replacement. The rotary dial shifter can leave park with the driver getting out, and screens freeze or go black. Crash-linked reports are heavier on the Sport, in power train, electrical and steering. On the Q8, only steering carries crash-linked reports.
| Component | Audi Q8 | Land Rover Range Rover Sport |
|---|---|---|
| ELECTRICAL SYSTEM | 6.4Average | 13.8Above Avg |
| POWER TRAIN | 5.1Average | 6.6Average |
| UNKNOWN OR OTHER | 1.1Low | 6.6Average |
| ENGINE | 1.8Low | 4.8Average |
| STEERING | 1.8Low | 3.7Average |
| VISIBILITY/WIPER | —None | 4.1Average |
| STRUCTURE | —None | 1.9Low |
| AIR BAGS | —None | 1.6Low |
| EXTERIOR LIGHTING | —None | 1.5Low |
| SUSPENSION | —None | 1.3Low |
| SERVICE BRAKES | 0.6Very Low | 0.7Very Low |
| FUEL SYSTEM | 1.1Low | —None |
| VEHICLE SPEED CONTROL | —None | 0.7Very Low |
| ENGINE AND ENGINE COOLING | —None | 0.7Very Low |
| SEAT BELTS | 0.2Very Low | 0.4Very Low |
| VISIBILITY | —None | 0.4Very Low |
| LATCHES/LOCKS/LINKAGES | —None | 0.4Very Low |
| BACK OVER PREVENTION | 0.2Very Low | —None |
| FORWARD COLLISION AVOIDANCE | 0.2Very Low | —None |
| LANE DEPARTURE | —None | 0.1Very Low |
| FUEL/PROPULSION SYSTEM | —None | 0.1Very Low |
Complaints per 10,000 units sold, aggregated across all tracked model years from NHTSA owner reports.
How Does Audi Q8 vs Land Rover Range Rover Sport Reliability Compare by Year?
| Year | Audi Q8 | Land Rover Range Rover Sport | Edge |
|---|---|---|---|
| 2026 | 70/1000R / 0C | 75/1003R / 0C | Land Rover Range Rover Sport |
| 2025 | 67/1002R / 1C | 68/1009R / 24C | Land Rover Range Rover Sport |
| 2024 | 64/1008R / 16C | 64/10022R / 47C | Tie |
| 2023 | 67/1003R / 2C | 52/10027R / 125C | Audi Q8 |
| 2022 | 65/1007R / 5C | 53/10023R / 94C | Audi Q8 |
| 2021 | 60/10014R / 28C | 53/10023R / 72C | Audi Q8 |
| 2020 | 63/1004R / 25C | 42/10037R / 138C | Audi Q8 |
| 2019 | 53/1005R / 103C | 56/10014R / 90C | Land Rover Range Rover Sport |
Best years to cross-shop: The 2023 Audi Q8 scored 67/100 and the 2024 Land Rover Range Rover Sport scored 64/100 — the strongest shared model years that have been on the road for at least two years, where available.
Who Should Buy the Audi Q8 vs the Land Rover Range Rover Sport?
Audi Q8 vs Land Rover Range Rover Sport: Common Questions
- Is the Audi Q8 more reliable than the Land Rover Range Rover Sport?
- Yes, the Q8 has a clear edge. Owners filed 21.4 complaints per 10,000 sold, against 56.4 for the Range Rover Sport. The Q8's standing is good, while the Sport's is mixed. The Q8's main weakness is alternator failure, which can cut power while driving.
- Which has more recalls, the Q8 or the Range Rover Sport?
- The Range Rover Sport has far more. Federal recall records show 177 recalls across 9 model years for the Sport, against 43 across 8 model years for the Q8. A high count means more repair visits, so check that all recall work is done before you buy.
- What is the most common serious problem on the Range Rover Sport?
- Split coolant pipes are the most repeated serious fault. They fail at the seam with no prior leak, often at highway speed, and trigger a stop-engine overheating warning. Reported failures clustered between 42,651 and 69,908 miles. Some cars needed a full engine replacement, and some owners saw the same pipe fail again.
- What goes wrong with the Audi Q8 alternator?
- The alternator can fail without warning while driving. A yellow electrical warning appears, red warnings follow, and the car loses power. Steering assist and stability control can drop out, and some cars stop and cannot restart. Most are towed, and some owners waited weeks or months for a back-ordered part.
- Which model years should I avoid?
- For the Q8, avoid 2019 and 2021, its weakest years. For the Range Rover Sport, avoid 2018 and 2020. The 2025 and 2026 years rank strongest for both, but they have had little time to collect complaints, so they are not proven. Check repair history on any car.
Related Reliability Comparisons
More Audi Q8 comparisons
More Land Rover Range Rover Sport comparisons
Decided between Audi Q8 and Land Rover Range Rover Sport? Run a VIN check before you buy — uncover hidden accidents, title issues, and open recalls.
How we score the Audi Q8 and Land Rover Range Rover Sport
Scores weight complaint severity at 35%, repair costs at 30%, recall impact at 20%, and the spread of complaints across systems at 15%, with complaint counts adjusted for US sales. Read the full methodology.
See incorrect data? Report an issue