Last updated: 2026-07-26
GMC Acadia vs Nissan Pathfinder: Reliability Compared
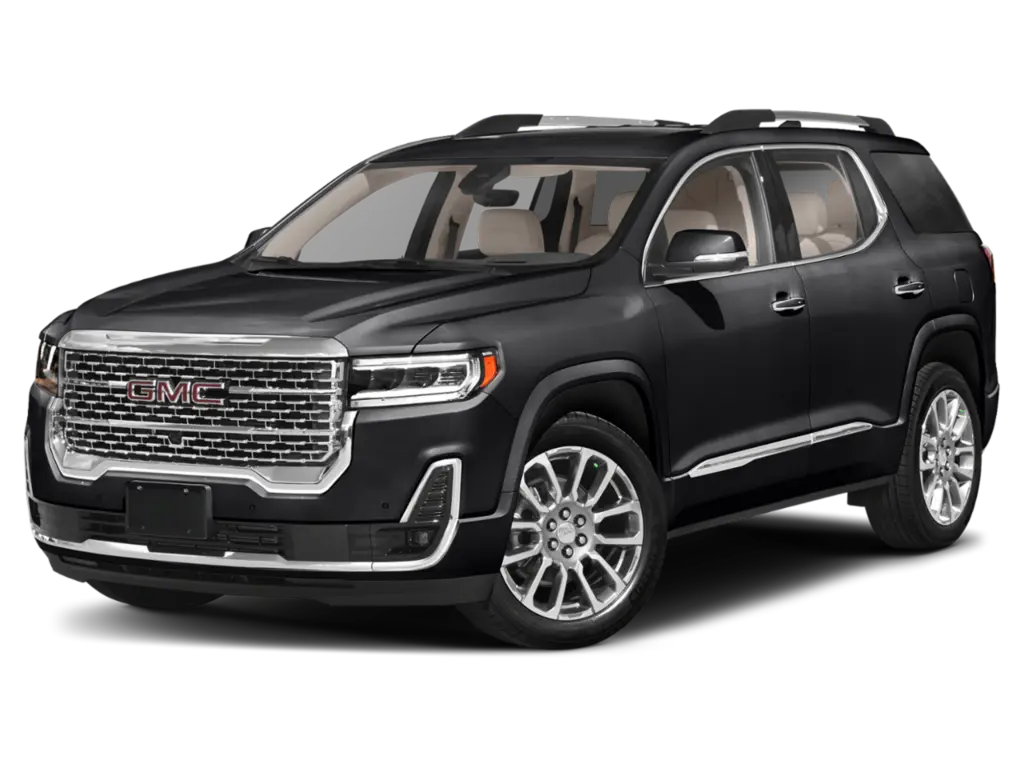
GMC Acadia
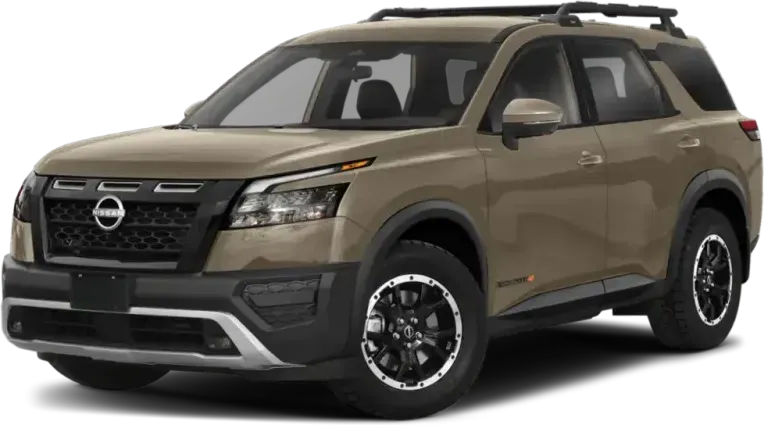
Nissan Pathfinder
Choosing between the GMC Acadia and the Nissan Pathfinder? This page compares their reliability scores, NHTSA recall history, owner-reported complaints, and estimated annual repair costs so you can make a confident long-term ownership decision between these two midsize suvs.
Our reliability scores are based on NHTSA recall and complaint data, independent repair cost estimates, and sales-normalized complaint rates. The Nissan Pathfinder currently leads with an average score of 74/100 compared to 70/100. Scroll down for the full year-by-year breakdown, common problem areas, and repair cost comparison.
How Do the GMC Acadia and Nissan Pathfinder Generations Compare?
Verdict
The Nissan Pathfinder is more reliable than the GMC Acadia, scoring 74/100 vs 70/100.
The Nissan Pathfinder demonstrates a slight edge in reliability over the GMC Acadia, with an average reliability score of 73/100 compared to the Acadia's 69/100. The Pathfinder also benefits from a lower owner complaint rate of 3.5 per 10,000 sold, whereas the Acadia's complaint data lacks normalization for direct comparison. Additionally, independent repair cost estimates favor the Pathfinder with an annual cost of $542, significantly less than the Acadia's $734. While both models have issues with power train and electrical systems, the Pathfinder's lower recall count of 14 versus the Acadia's 17 further solidifies its superior reliability standing.
Key Differences
- 1Nissan Pathfinder costs $192 less per year to repair
- 2Nissan Pathfinder scores 4 points higher in reliability
- 3Nissan Pathfinder has 4% lower major repair risk
Category Scoreboard
GMC Acadia vs Nissan Pathfinder: Which Is More Reliable?
| Metric | GMC Acadia | Nissan Pathfinder |
|---|---|---|
| Reliability Score | 70/100 | 74/100 |
| Years Tracked | 8 | 8 |
| Total Recalls | 17 | 14 |
| Total ComplaintsRaw count — varies with sales volume | 770 | 457 |
| Annual Repair Cost | $734/yr | $542/yr |
| Repair Frequency | 0.4/yr | 0.4/yr |
| Major Repair Risk | 19% | 15% |
| Safety RatingNHTSA overall | 2026 NHTSA | 2026 NHTSA |
| Frontal | ||
| Side | ||
| Rollover | ||
| Year Wins | 1 (2 tied) | 4 (2 tied) |
What Are the Common Problems With the GMC Acadia and Nissan Pathfinder?
The Nissan Pathfinder and GMC Acadia exhibit differing problem profiles, with the Acadia having a higher total number of complaints. The Acadia shows significant issues with the power train and electrical system, both categories having over 100 complaints and multiple crash-linked incidents, indicating potential safety concerns. Conversely, the Pathfinder's most frequently reported issues are in the categories of unknown or other, electrical system, and power train, with fewer crash-linked complaints overall. Notably, the Acadia also has a higher incidence of airbag-related complaints, with a substantial proportion being crash-related, a safety aspect less prominent in the Pathfinder's profile.
| Component | GMC Acadia | Nissan Pathfinder |
|---|---|---|
| POWER TRAIN | 200 | 60 |
| ELECTRICAL SYSTEM | 139 | 64 |
| UNKNOWN OR OTHER | 106 | 64 |
| SERVICE BRAKES | 70 | 58 |
| ENGINE | 37 | 35 |
| STEERING | 55 | 10 |
| FUEL/PROPULSION SYSTEM | 23 | 13 |
| VEHICLE SPEED CONTROL | 7 | 21 |
| AIR BAGS | 12 | 12 |
| SEATS | 3 | 16 |
| FORWARD COLLISION AVOIDANCE | 8 | 4 |
| STRUCTURE | 2 | 10 |
| ELECTRONIC STABILITY CONTROL (ESC) | 4 | 7 |
| SEAT BELTS | 9 | — |
| FUEL SYSTEM | 4 | 3 |
| SUSPENSION | 4 | 3 |
| EXTERIOR LIGHTING | 6 | — |
| VISIBILITY/WIPER | 2 | 3 |
| BACK OVER PREVENTION | — | 3 |
| ENGINE AND ENGINE COOLING | 2 | — |
| LANE DEPARTURE | 2 | — |
Raw complaint counts aggregated across all tracked model years from NHTSA owner reports. Counts vary with sales volume.
Which Is Cheaper to Maintain: GMC Acadia or Nissan Pathfinder?
How Does GMC Acadia vs Nissan Pathfinder Reliability Compare by Year?
| Year | GMC Acadia | Nissan Pathfinder | Edge |
|---|---|---|---|
| 2026 | 76/1000R / 0C | 82/1000R / 1C | Nissan Pathfinder |
| 2025 | 76/1000R / 51C | 78/1001R / 25C | Nissan Pathfinder |
| 2024 | 76/1000R / 51C | 74/1002R / 38C | GMC Acadia |
| 2023 | 64/1004R / 37C | 74/1001R / 86C | Nissan Pathfinder |
| 2022 | 66/1003R / 44C | 66/1005R / 119C | Tie |
| 2020 | 62/1006R / 84C | 78/1000R / 43C | Nissan Pathfinder |
| 2018 | 68/1002R / 369C | 68/1003R / 74C | Tie |
Best years to cross-shop: The 2026 GMC Acadia scored 76/100 and the 2026 Nissan Pathfinder scored 82/100 — these represent the strongest model years in our tracking range.
Who Should Buy the GMC Acadia vs the Nissan Pathfinder?
GMC Acadia vs Nissan Pathfinder: Common Questions
- Is the GMC Acadia more reliable than the Nissan Pathfinder?
- Based on our data, the Nissan Pathfinder is more reliable with an average score of 74/100 compared to 70/100. The difference is modest, so both are reasonable choices.
- Which has more recalls, the GMC Acadia or the Nissan Pathfinder?
- The GMC Acadia has more recalls (17) compared to the Nissan Pathfinder (14). More recalls don't always mean worse reliability — some are minor — but it's worth reviewing what each recall covers.
- Which has fewer owner complaints, the GMC Acadia or the Nissan Pathfinder?
- The Nissan Pathfinder has fewer owner complaints (457) versus 770 for the GMC Acadia. Note that models with higher sales naturally generate more complaints.
- Which is cheaper to maintain, the GMC Acadia or the Nissan Pathfinder?
- Based on independent repair cost estimates, the Nissan Pathfinder is cheaper to maintain at $542/year versus $734/year for the GMC Acadia.
- Is the GMC Acadia or Nissan Pathfinder safer?
- Both the GMC Acadia and Nissan Pathfinder received the same NHTSA overall safety rating of 5/5 stars. Check the frontal, side, and rollover sub-ratings above for a more detailed comparison.
Related Reliability Comparisons
More GMC Acadia comparisons
Decided between GMC Acadia and Nissan Pathfinder? Run a VIN check before you buy — uncover hidden accidents, title issues, and open recalls.
Affiliate link — we may earn a commission at no cost to you.
How We Calculate Reliability Scores
Auto Reliability Index scores are calculated on a 0–100 scale using a weighted formula that combines multiple public data sources. Each factor is weighted based on its predictive value for real-world ownership experience.
Key Ranking Factors
Complaint Severity
NHTSA owner complaints weighted by component category (e.g., powertrain, safety systems, electronics, cosmetic) — safety-critical issues carry more weight than cosmetic ones. Adjusted for sales volume so high-volume models aren't unfairly penalized.
Repair Costs
Independent reliability ratings based on repair frequency, average repair costs, and severity of typical repairs for each model.
Recall Impact
Number of NHTSA recalls weighted by severity. “Stop driving” and fire-risk recalls are penalized more heavily than minor software or labeling recalls.
Issue Diversity
Measures how many major vehicle systems (engine, transmission, electrical, braking, etc.) have recorded complaints. A vehicle with issues spread across many systems may indicate systemic quality issues.
Scores are grouped into four tiers:
- 80–100: Excellent— Top-tier reliability, minimal issues
- 60–79: Good— Reliable with some minor concerns
- 40–59: Mixed— Notable issues, research before buying
- 0–39: Risky— Significant problems, proceed with caution
Data is sourced from NHTSA recall records, owner complaint filings, and independent repair databases. Scores are recalculated as new data becomes available. While the weighting model is proprietary, all underlying data sources are public and traceable.
See incorrect data? Report an issue