Last updated: 2026-10-10
Dodge Charger vs Toyota Camry: Reliability Compared
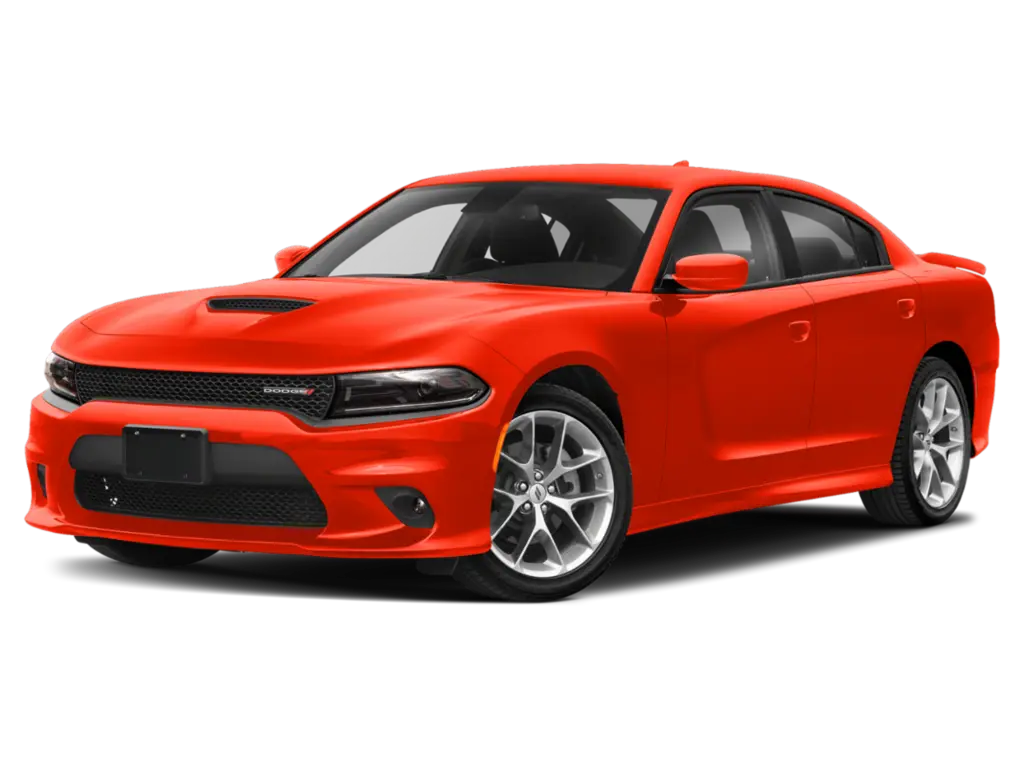
Dodge Charger
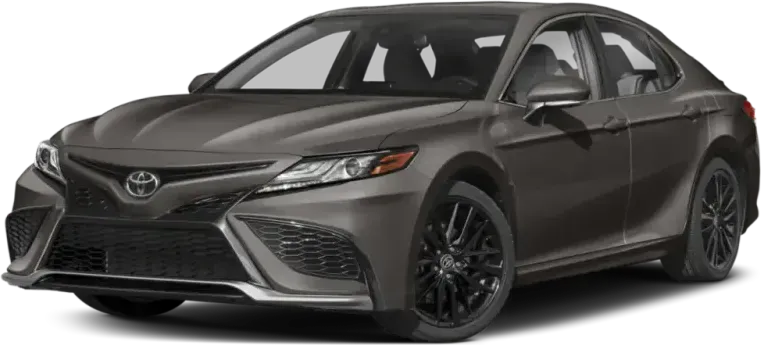
Toyota Camry
The Toyota Camry has a slight reliability edge over the Dodge Charger, mainly because its repairs cost less and are less often major. Both cars hold a good standing. The Charger visits the shop less often, but its touchscreen and door panel failures can get expensive.
How Do the Dodge Charger and Toyota Camry Generations Compare?
Verdict
The Toyota Camry is more reliable than the Dodge Charger, scoring 78/100 vs 74/100.
Slight edge goes to the Camry. Both cars hold a good reliability standing, and owner complaints per car sold are nearly the same. What separates them is the cost and weight of a repair. Independent repair-cost data shows the Camry with a lower yearly bill and a lower chance that a repair is major. The Charger does reach the shop a little less often, but its failures, such as a dead touchscreen quoted at over $2,000, hit harder when they come. The gap is small, so condition and history matter more than the badge.
Key Differences
- 1Toyota Camry costs $264 less per year to repair
- 2Dodge Charger has 10 fewer total recalls
- 3Toyota Camry scores 4 points higher in reliability
Category Scoreboard
Dodge Charger vs Toyota Camry: Which Is More Reliable?
| Metric | Dodge Charger | Toyota Camry |
|---|---|---|
| Reliability Score | 74/100 | 78/100 |
| Years Tracked | 9 | 9 |
| Total Recalls | 25 | 35 |
| Complaints per 10k Sold | 2.2 | 2.1 |
| Annual Repair Cost | $652/yr | $388/yr |
| Repair Frequency | 0.2/yr | 0.3/yr |
| Major Repair Risk | 15% | 11% |
| Year Wins | 2 (1 tied) | 6 (1 tied) |
What Are the Common Problems With the Dodge Charger and Toyota Camry?
The two cars fail in different places. Charger complaints center on a touchscreen that delaminates and registers phantom touches, door panels that peel away from the frame, and electric steering assist that cuts out at low speed. Camry complaints lean toward drivetrain and safety systems: an engine that shuts off with the shifter still in Drive, hesitation under throttle, a spongy brake pedal, and a coolant bypass valve that fails around 30,000 to 34,000 miles. Crash-linked reports are heavier on the Camry, which has them in brakes, air bags, power train, electrical and engine. The Charger's crash-linked reports sit in air bags and power train only.
| Component | Dodge Charger | Toyota Camry |
|---|---|---|
| AIR BAGS | 0.6Very Low | 0.2Very Low |
| ELECTRICAL SYSTEM | 0.5Very Low | 0.2Very Low |
| POWER TRAIN | 0.1Very Low | 0.4Very Low |
| UNKNOWN OR OTHER | 0.2Very Low | 0.2Very Low |
| SERVICE BRAKES | 0.1Very Low | 0.2Very Low |
| STEERING | 0.1Very Low | 0.1Very Low |
| ENGINE | 0.1Very Low | 0.1Very Low |
| STRUCTURE | 0.1Very Low | —None |
| FUEL/PROPULSION SYSTEM | —None | 0.1Very Low |
| VEHICLE SPEED CONTROL | —None | 0.1Very Low |
| FUEL SYSTEM | —None | 0.1Very Low |
| EXTERIOR LIGHTING | —None | —None |
| WHEELS | —None | —None |
| SUSPENSION | —None | —None |
| VISIBILITY | —None | —None |
| FORWARD COLLISION AVOIDANCE | —None | —None |
| TIRES | —None | —None |
| SEAT BELTS | —None | —None |
| VISIBILITY/WIPER | —None | —None |
Complaints per 10,000 units sold, aggregated across all tracked model years from NHTSA owner reports.
Which Is Cheaper to Maintain: Dodge Charger or Toyota Camry?
How Does Dodge Charger vs Toyota Camry Reliability Compare by Year?
| Year | Dodge Charger | Toyota Camry | Edge |
|---|---|---|---|
| 2026 | 82/1000R / 0C | 88/1000R / 0C | Toyota Camry |
| 2025 | 71/1002R / 10C | 76/1004R / 6C | Toyota Camry |
| 2024 | 73/1002R / 4C | 83/1002R / 35C | Toyota Camry |
| 2023 | 76/1002R / 22C | 79/1004R / 47C | Toyota Camry |
| 2022 | 74/1003R / 11C | 84/1002R / 47C | Toyota Camry |
| 2021 | 76/1002R / 29C | 82/1002R / 144C | Toyota Camry |
| 2020 | 75/1003R / 54C | 75/1005R / 253C | Tie |
| 2019 | 71/1005R / 118C | 70/1008R / 364C | Dodge Charger |
| 2018 | 69/1006R / 121C | 65/1008R / 708C | Dodge Charger |
Best years to cross-shop: The 2023 Dodge Charger scored 76/100 and the 2022 Toyota Camry scored 84/100 — the strongest shared model years that have been on the road for at least two years, where available.
Who Should Buy the Dodge Charger vs the Toyota Camry?
Dodge Charger vs Toyota Camry: Common Questions
- Is the Dodge Charger more reliable than the Toyota Camry?
- No, the Camry has a slight edge. Both hold a good standing and draw similar complaint rates per car sold. The Camry wins on cost, with a lower annual repair bill and a lower chance that a repair is major. The Charger needs fewer unscheduled shop visits.
- Which has more recalls, the Charger or the Camry?
- The Camry has more. Federal recall records show 35 recalls across nine model years for the Camry and 25 for the Charger. Recall counts reflect how many fixes were issued, not how often cars fail, so check any specific car's VIN for open recalls.
- Which is cheaper to repair, the Charger or the Camry?
- The Camry is cheaper. Independent repair-cost data estimates $388 a year for the Camry and $652 for the Charger. Over five years that is about $1,320 more for the Charger. A Charger touchscreen replacement was quoted at over $2,000 in owner reports.
- What is the most common Charger problem?
- Air bags draw the most Charger complaints, at 98, but electrical trouble is the most visible one. The Uconnect 8.4 touchscreen delaminates and registers phantom touches, changing stations and climate settings. Some screens failed at 5,000 to 6,900 miles, often just after the warranty ended.
- What goes wrong most often on the Camry?
- Power train complaints lead for the Camry, at 291. One report describes the engine shutting off and the key coming out with the shifter in Drive, with no warning. Another describes hesitation when pressing the gas. Engine owners also report a failing coolant bypass valve, usually around 30,000 to 34,000 miles.
Related Reliability Comparisons
More Dodge Charger comparisons
Decided between Dodge Charger and Toyota Camry? Run a VIN check before you buy — uncover hidden accidents, title issues, and open recalls.
How we score the Dodge Charger and Toyota Camry
Scores weight complaint severity at 35%, repair costs at 30%, recall impact at 20%, and the spread of complaints across systems at 15%, with complaint counts adjusted for US sales. Read the full methodology.
See incorrect data? Report an issue