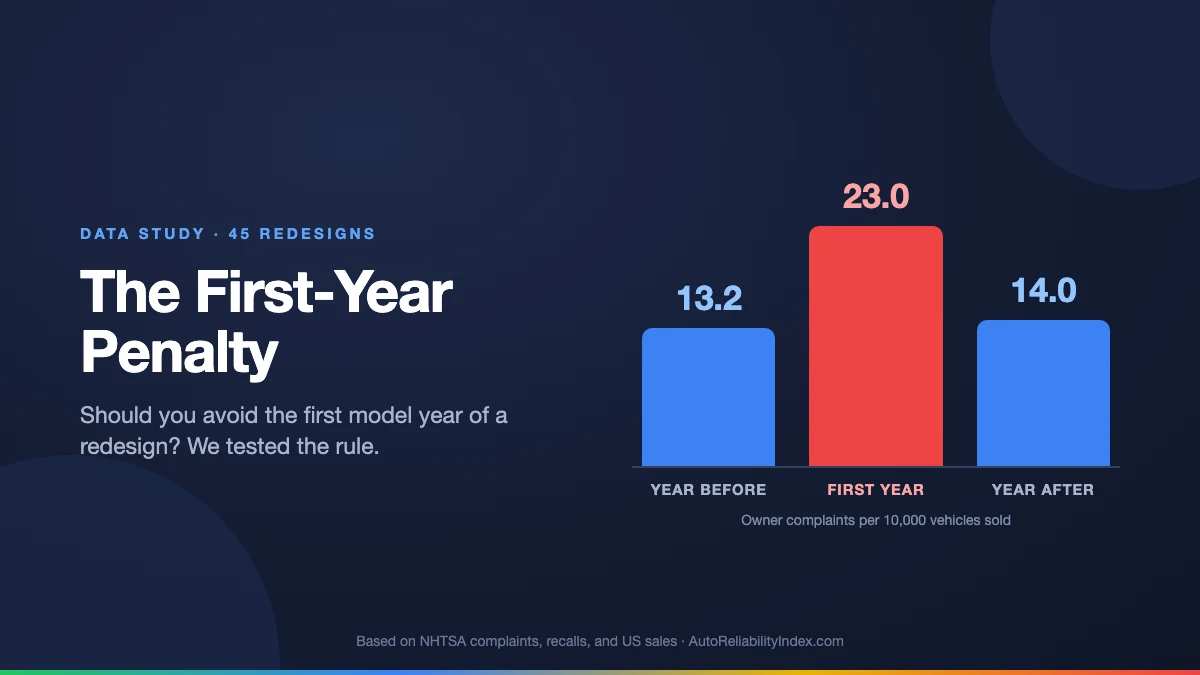
"Never buy the first year of a new generation" is the most repeated piece of used-car advice there is. Mechanics say it, Consumer Reports says it, and your uncle definitely says it. We wanted to know whether it holds up in the federal complaint data, how big the effect really is, and whether waiting a single year is enough.
So we took every redesign in our database where we could compare three things side by side: the last model year of the old generation, the first year of the new one, and the year after that. Forty-five redesigns qualified, from the 2019 Toyota RAV4 to the 2022 Toyota Tundra.
The rule holds, and it holds by a wide margin.
The short answer
- First-year models drew 74% more owner complaints per car sold than the final year of the generation they replaced: 23.0 complaints per 10,000 vehicles sold against 13.2.
- The second year recovered almost completely, falling to 14.0 complaints per 10,000 sold, close to where the old generation ended.
- 30 of the 45 first years had more complaints per car sold than both the year before and the year after. Only 6 had fewer than both.
- First years also carried more recalls. The median first year had 7 recalls, against 3 for the year before and 5 for the year after.
- The extra complaints are concentrated in new hardware and new tech: steering, transmissions, fuel systems, backup cameras, lane keeping, and automatic emergency braking.
How we tested it
For each redesign we looked at three consecutive model years of the same nameplate:
| What it is | Why it is in the test | |
|---|---|---|
| Year before | Final model year of the outgoing generation | The most debugged version of the old design |
| First year | First model year of the new generation | The year the rule says to avoid |
| Year after | Second model year of the new generation | What you get if you wait one year |
We counted every owner complaint filed with NHTSA for each model year and divided it by the number of that model sold in the US, so a best-seller like the F-150 is not penalized for its size. Generation dates come from each model's US model-year history. We only used redesigns whose first year falls between 2019 and 2022, so every year in the comparison has been on the road for at least two years and has had time to collect complaints.
That last point matters. Older cars have had longer to rack up complaints, so in a straight comparison the year before a redesign should look worse, not better, than the first year. The bias works against the rule we were testing. The first year still came out worse in 34 of 45 cases.
The results
Across all 45 redesigns, pooled by sales:
| Year before | First year | Year after | |
|---|---|---|---|
| Owner complaints per 10,000 sold | 13.2 | 23.0 | 14.0 |
| Crash-related complaints per 10,000 sold | 0.67 | 0.80 | 0.58 |
| Median recalls per model year | 3 | 7 | 5 |
| Median reliability score (0–100) | 71 | 66 | 70 |
The pattern is a spike, not a slope. Complaints jump in the first year and fall back the next, which is what you would expect if the cause is launch problems that get fixed, rather than a newer design that is simply worse.
Looking model by model instead of pooling, the typical first year drew 1.58 times the average complaint rate of the year before and the year after.
What breaks in a first year
Splitting the complaints by problem area shows where launch trouble comes from. Rates below are complaints per 10,000 vehicles sold, across the same 45 redesigns.
| Problem area | Year before | First year | Year after | First year vs year before |
|---|---|---|---|---|
| Backup camera | 0.04 | 0.26 | 0.13 | 6.6× |
| Steering | 0.63 | 2.47 | 1.14 | 3.9× |
| Lane keeping | 0.03 | 0.10 | 0.08 | 3.7× |
| Automatic emergency braking | 0.13 | 0.36 | 0.19 | 2.7× |
| Fuel system | 0.47 | 1.09 | 0.58 | 2.3× |
| Transmission | 1.92 | 3.79 | 2.14 | 2.0× |
| Engine | 1.76 | 2.92 | 1.95 | 1.7× |
| Electrical | 2.23 | 2.95 | 2.11 | 1.3× |
| Airbags | 0.59 | 0.49 | 0.52 | 0.8× |
| Wheels and tires | 0.43 | 0.33 | 0.21 | 0.8× |
Two groups stand out. The first is new driver-assist and camera hardware: backup cameras, lane keeping, and automatic emergency braking all jump two to seven times. These systems are often brand new to a generation, and their software gets updated in the months after launch. J.D. Power's Initial Quality Study, which surveys new-car owners in their first 90 days, has found the same launch penalty: in 2014, all-new or redesigned vehicles averaged 128 problems per 100 vehicles against 113 for carryover models.
The second group is new mechanical hardware: steering, transmissions, and fuel systems. A redesign often brings a new electric power steering rack, a new transmission, or a new engine, and those are the parts that strand people.
Parts that rarely change between generations, such as airbags and wheels, show no first-year spike at all.
The first years with the biggest spikes
Some of the most popular vehicles in the country had rough launches. Complaint rates are per 10,000 sold.
| Redesign | Year before | First year | Year after | What owners reported most |
|---|---|---|---|---|
| 2022 Honda Civic | 4.5 | 69.8 | 15.7 | Steering (790 of 935 complaints) |
| 2020 Kia Soul | 12.6 | 47.1 | 25.3 | Engine, transmission |
| 2020 Ford Explorer | 13.5 | 47.1 | 16.1 | Transmission, electrical, backup camera |
| 2022 Toyota Tundra | 2.8 | 37.0 | 25.6 | Transmission, engine |
| 2021 Ford F-150 | 10.3 | 22.0 | 15.9 | Transmission, electrical |
| 2019 Toyota RAV4 | 7.7 | 19.3 | 14.2 | Fuel system, engine |
| 2019 Chevrolet Silverado | 9.4 | 18.1 | 11.7 | Transmission, engine |
| 2020 Toyota Corolla | 6.2 | 12.2 | 7.2 | Engine |
The 2022 Civic is the clearest case in the data. Its complaint rate was more than 15 times the 2021 model's, and 790 of its 935 complaints are about steering. Owners describe a wheel that sticks or catches at highway speed. NHTSA opened an investigation into "sticky steering" on 2022 and 2023 Civics in March 2023 and upgraded it to an engineering analysis that November, adding the 2023 CR-V and Acura Integra. The 2023 Civic still drew more than three times the complaint rate of the 2021, so this is a case where waiting one year helped but did not fully fix things.
The 2020 Explorer shows what a rushed launch looks like. Ford retooled its Chicago plant for the new Explorer in about a month and later admitted the launch was botched, with cars shipped to another factory for repairs. In our data the first year carried 29 recalls, against 4 the year before, and owners filed more than a thousand complaints, led by transmission problems.
The 2022 Tundra is a reminder that the rule applies to Toyota too. The redesign swapped the old V8 for a new twin-turbo V6 and a new 10-speed transmission, and complaints about both followed. Unlike most redesigns, the second year stayed elevated.
The exceptions
Six of the 45 first years drew fewer complaints per car sold than both the year before and the year after. Among them:
- 2020 Toyota Highlander: 12.7 complaints per 10,000 sold, against 17.3 for the 2019 and 15.3 for the 2021.
- 2021 Hyundai Elantra: 11.5, against 20.1 for the 2020 and 11.9 for the 2022.
- 2019 Hyundai Santa Fe: 15.8, against 41.8 for the 2018 and 16.3 for the 2020.
- 2019 BMW 3 Series: 7.1, against 13.0 for the 2018 and 11.5 for the 2020.
No single trait explains these exceptions in our data, and some automakers simply launch new models more cleanly than others. So the rule is a default, not a law. If you are looking at a specific first-year car, look at its own record rather than assuming the worst.
One disagreement worth flagging: Consumer Reports singled out the redesigned 2019 Toyota Avalon as one of the few new models with above-average predicted reliability. In the NHTSA complaint data, the 2019 Avalon's complaint rate was more than three times that of the 2018 and 2020. The numbers are small (68 complaints), and owner surveys and federal complaints measure different things, but it shows why checking more than one source pays off.
Does waiting one year fix it?
Mostly, yes. The second year of a generation drew 39% fewer complaints per car sold than the first, and in 35 of 45 redesigns the second year was better than the first. Pooled across all 45, the second year landed within about 6% of the old generation's final year.
The catch is recalls. The median second year still had 5 recalls, more than the final year of the old generation. Many of those are fixes for launch problems that apply to both the first and second years, so a used second-year car is only as good as its recall history.
What this means if you are buying used
- The safest picks are the final year of a generation and the second or later years of a new one. The final year of the old design has had the most time to get debugged. The second year of a new one keeps the new design but skips most of the launch trouble.
- A first-year car can still be a good buy, but check it individually. Look up the exact model year on its reliability page, read what owners actually report, and look at the problem pages for its biggest complaint areas.
- Ask for proof that every recall was completed. First-year cars collect more recalls than any other year. A VIN check will show open recalls, and the seller's service records should show the completed ones.
- Pay attention to new tech on a test drive. Backup cameras, lane keeping, and automatic emergency braking are where first-year complaints grow fastest. Test each one, and watch for false braking or a camera that cuts out.
- Look at the years-to-avoid page for the model you want. It ranks every model year we track and explains what went wrong with the weak ones.
Limits of this analysis
Owner complaints are not the same as failures. Some owners never file, and well-publicized problems can draw more complaints than quiet ones. Complaint rates also depend on accurate sales figures, which are less reliable for low-volume models; we left out redesigns where any of the three years sold fewer than 1,000 units. Our data starts with the 2018 model year, so redesigns before 2019 are not included, and each redesign counts once regardless of how many cars were sold. Even with those limits, a 74% jump that shows up in two out of three redesigns is hard to explain away.
Should you avoid the first model year of a redesign?
Is the second year of a new generation safe to buy?
What problems are most common in the first year of a redesign?
Which redesigns had the worst first year?
Is the last year of a generation the most reliable?
Sources
- Owner complaints and recalls: NHTSA complaint and recall databases, model years 2018–2023, as of October 2026. US sales figures by model year from published sales data.
- Consumer Reports, "Consumer Reports cautions consumers to pump the brakes when considering buying the newest model cars", November 2019.
- J.D. Power 2014 Initial Quality Study, as reported in "Porsche retains J.D. Power's top quality title", The Blade, June 2014.
- NHTSA Office of Defects Investigation, Preliminary Evaluation PE23-005 and Engineering Analysis EA23-003, Honda steering effort.
- Ford Authority, "Ford admits to errors in 2020 Ford Explorer launch", November 2019.