Last updated: 2026-10-10
Kia Sportage vs Subaru Forester: Reliability Compared
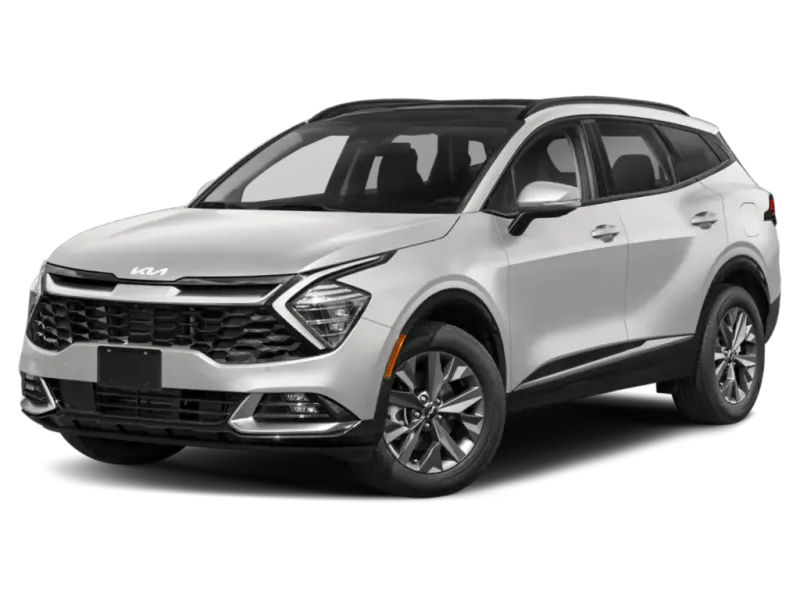
Kia Sportage
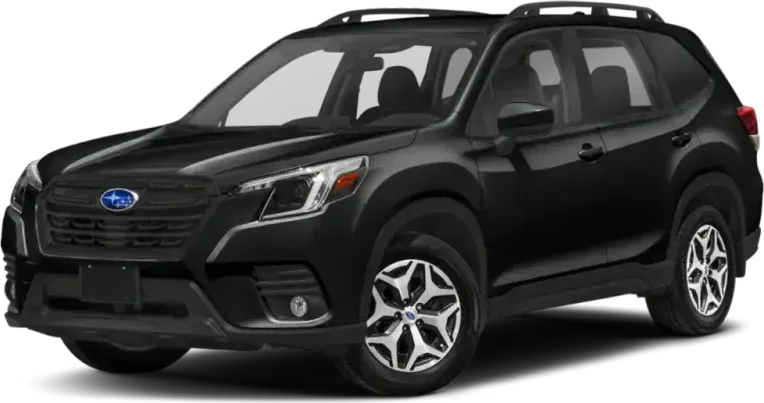
Subaru Forester
The KIA Sportage and Subaru Forester are effectively tied on reliability, so the choice depends on which kind of trouble you can live with. The Sportage costs less to repair. The Forester has fewer recalls, but owners file far more complaints, mostly about cracked windshields and stalling.
How Do the Kia Sportage and Subaru Forester Generations Compare?
Verdict
The Kia Sportage is more reliable than the Subaru Forester, scoring 75/100 vs 74/100.
Reliability is effectively tied. Both models sit at a good standing, and neither pulls clearly ahead. The Sportage is cheaper to keep on the road and draws fewer owner complaints, but its worst reports are the more frightening ones: engines that lock up and cruise control that surges. The Forester collects far more complaints, yet most are cracked windshields and start/stop stalls. Pick on the kind of trouble you can tolerate, not on a winner.
Key Differences
- 1Kia Sportage costs $170 less per year to repair
- 2Subaru Forester has 15 fewer total recalls
- 3Kia Sportage has 3.4 fewer complaints per 10k sold
Category Scoreboard
Kia Sportage vs Subaru Forester: Which Is More Reliable?
| Metric | Kia Sportage | Subaru Forester |
|---|---|---|
| Reliability Score | 75/100 | 74/100 |
| Years Tracked | 9 | 9 |
| Total Recalls | 28 | 13 |
| Complaints per 10k Sold | 5.3 | 8.7 |
| Annual Repair Cost | $462/yr | $632/yr |
| Repair Frequency | 0.2/yr | 0.4/yr |
| Major Repair Risk | 11% | 13% |
| Safety RatingNHTSA overall | 2026 NHTSA | 2026 NHTSA |
| Frontal | ||
| Side | ||
| Rollover | ||
| Year Wins | 5 (2 tied) | 2 (2 tied) |
What Are the Common Problems With the Kia Sportage and Subaru Forester?
Engine failure and runaway cruise control set the Sportage apart. Owners report engines that run low on oil between changes, then knock or lock up and need replacing. Cruise control that sets itself to 110 mph is the other signature complaint. Brakes and speed control each carry 10 crash-linked complaints, and neither area is among the Forester's main problems. Forester owners mostly describe windshields that crack with no impact, sometimes within a few thousand miles, plus engines that die at stops when start/stop fails to restart. Its air bag category has 22 crash-linked complaints, but the described crash reads like unintended acceleration, not an air bag fault.
| Component | Kia Sportage | Subaru Forester |
|---|---|---|
| VISIBILITY/WIPER | —None | 3.1Average |
| ELECTRICAL SYSTEM | 0.9Very Low | 1.2Low |
| UNKNOWN OR OTHER | 0.8Very Low | 1.2Low |
| ENGINE | 1Very Low | 0.4Very Low |
| POWER TRAIN | 0.4Very Low | 0.4Very Low |
| AIR BAGS | 0.1Very Low | 0.5Very Low |
| VISIBILITY | 0.1Very Low | 0.5Very Low |
| SERVICE BRAKES | 0.3Very Low | 0.1Very Low |
| VEHICLE SPEED CONTROL | 0.2Very Low | 0.2Very Low |
| STEERING | 0.2Very Low | 0.1Very Low |
| STRUCTURE | 0.2Very Low | 0.1Very Low |
| FORWARD COLLISION AVOIDANCE | 0.1Very Low | 0.1Very Low |
| EXTERIOR LIGHTING | 0.1Very Low | 0.1Very Low |
| ENGINE AND ENGINE COOLING | 0.1Very Low | —None |
| LANE DEPARTURE | 0.1Very Low | —None |
| TRAILER HITCHES | 0.1Very Low | —None |
| SEATS | —None | —None |
| SUSPENSION | —None | —None |
Complaints per 10,000 units sold, aggregated across all tracked model years from NHTSA owner reports.
Which Is Cheaper to Maintain: Kia Sportage or Subaru Forester?
How Does Kia Sportage vs Subaru Forester Reliability Compare by Year?
| Year | Kia Sportage | Subaru Forester | Edge |
|---|---|---|---|
| 2026 | 83/1003R / 4C | 77/1001R / 0C | Kia Sportage |
| 2025 | 82/1002R / 44C | 79/1002R / 48C | Kia Sportage |
| 2024 | 78/1004R / 83C | 78/1002R / 26C | Tie |
| 2023 | 67/1009R / 257C | 79/1001R / 61C | Subaru Forester |
| 2022 | 79/1001R / 39C | 77/1001R / 86C | Kia Sportage |
| 2021 | 76/1002R / 34C | 76/1000R / 196C | Tie |
| 2020 | 69/1002R / 139C | 71/1000R / 584C | Subaru Forester |
| 2019 | 74/1002R / 63C | 63/1003R / 825C | Kia Sportage |
| 2018 | 68/1003R / 147C | 66/1003R / 475C | Kia Sportage |
Best years to cross-shop: The 2022 Kia Sportage scored 79/100 and the 2023 Subaru Forester scored 79/100 — the strongest shared model years that have been on the road for at least two years, where available.
Who Should Buy the Kia Sportage vs the Subaru Forester?
Kia Sportage vs Subaru Forester: Common Questions
- Is the KIA Sportage more reliable than the Subaru Forester?
- The two are effectively tied. Both hold a good reliability standing. The Sportage has fewer owner complaints and lower repair costs. Its complaints are more severe, though, including engine failure and runaway cruise control. The Forester's complaints are more numerous but center on windshield cracks and start/stop stalling.
- Which has more recalls, the Sportage or the Forester?
- The Sportage has more. Federal recall records show 28 recalls across its 9 model years, against 13 for the Forester. Check any specific car's VIN for open recalls before you buy, because the count across all years does not tell you whether a given car was fixed.
- Which costs less to repair, the Sportage or the Forester?
- The Sportage costs less. Independent repair-cost data puts it near $462 a year against $632 for the Forester, which is about $850 over five years. It also averages 0.2 unscheduled shop visits a year, half the Forester's 0.4.
- Do Subaru Foresters have a windshield cracking problem?
- Owner complaints say yes. It is the largest problem group, with 819 complaints in the visibility/wiper category alone. Owners describe cracks with no impact, sometimes within the first few thousand miles. Replacement is often quoted at over $1000, and some owners are on a second or third windshield.
- What goes wrong with the KIA Sportage engine?
- Owners report oil running out between changes, followed by knocking, ticking, or lockup, and most of these cases end in engine replacement. A flashing check engine light and sudden loss of speed on the highway are common signs. Some owners say warranty claims were denied over maintenance records.
Related Reliability Comparisons
More Kia Sportage comparisons
Decided between Kia Sportage and Subaru Forester? Run a VIN check before you buy — uncover hidden accidents, title issues, and open recalls.
How we score the Kia Sportage and Subaru Forester
Scores weight complaint severity at 35%, repair costs at 30%, recall impact at 20%, and the spread of complaints across systems at 15%, with complaint counts adjusted for US sales. Read the full methodology.
See incorrect data? Report an issue