Last updated: 2026-10-10
Hyundai Ioniq 5 vs Toyota RAV4: Reliability Compared
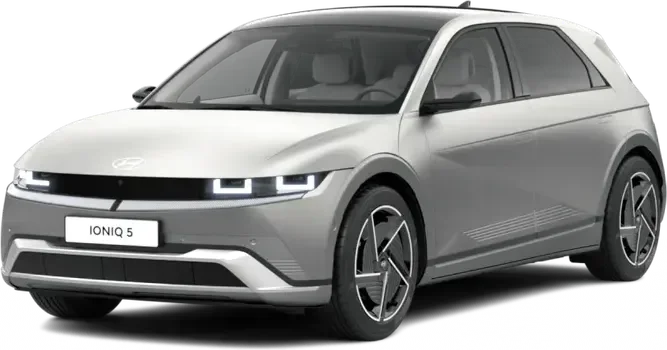
Hyundai Ioniq 5
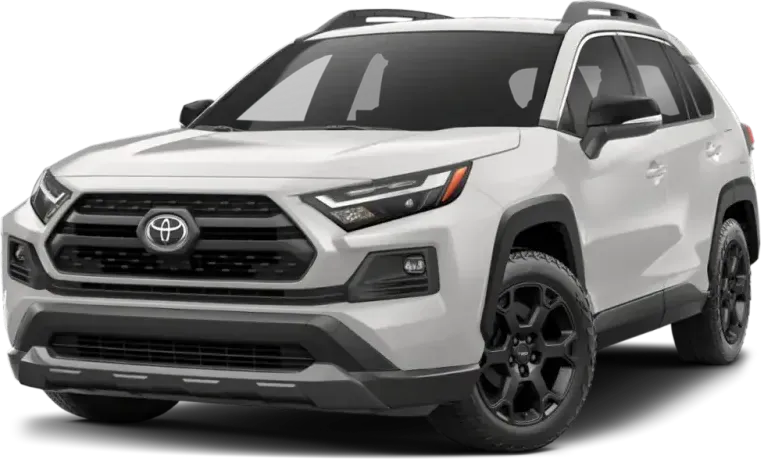
Toyota RAV4
Between the Toyota RAV4 and Hyundai Ioniq 5, the RAV4 comes out well ahead on reliability. Ioniq 5 owners file far more complaints per car. The deciding fact is the Ioniq 5's ICCU failure, which can cut power and leave the car stranded.
How Do the Hyundai Ioniq 5 and Toyota RAV4 Generations Compare?
Verdict
The Toyota RAV4 is more reliable than the Hyundai Ioniq 5, scoring 76/100 vs 54/100.
Reliability favors the RAV4 by a large margin. It holds a good standing, while the Ioniq 5 sits at mixed. Owners file 4.4 complaints per 10,000 RAV4s sold, against 63.4 for the Ioniq 5. The deciding issue is the Ioniq 5's ICCU failure, which brings a "check electrical system" warning, a power-limited mode, and often a dead car. The RAV4's worst area, air bags that did not deploy in crashes, is serious. It still sits inside a far lower overall complaint rate.
Key Differences
- 1Toyota RAV4 has 59.0 fewer complaints per 10k sold
- 2Hyundai Ioniq 5 has 35 fewer total recalls
- 3Toyota RAV4 scores 22 points higher in reliability
Category Scoreboard
Hyundai Ioniq 5 vs Toyota RAV4: Which Is More Reliable?
| Metric | Hyundai Ioniq 5 | Toyota RAV4 |
|---|---|---|
| Reliability Score | 54/100 | 76/100 |
| Years Tracked | 5 | 8 |
| Total Recalls | 18 | 53 |
| Complaints per 10k Sold | 63.4 | 4.4 |
| Year Wins | 0 | 4 |
What Are the Common Problems With the Hyundai Ioniq 5 and Toyota RAV4?
One failed part drives most Ioniq 5 trouble. A bad ICCU produces a pop, a warning, a speed cap, and a stalled car, and it can return after recall work. RAV4 complaints spread wider: dashboard warning floods, fuel tanks that stop filling early on Hybrid and Prime models, and coolant bypass valve failure. The sharpest difference is crash-linked air bag reports. RAV4 owners describe front and side bags that stayed folded in serious crashes, with 71 crash-linked complaints. Air bags are not a main problem area for the Ioniq 5, whose crash-linked reports involve driver-assist faults and surging.
| Component | Hyundai Ioniq 5 | Toyota RAV4 |
|---|---|---|
| ELECTRICAL SYSTEM | 36.8High | 0.7Very Low |
| POWER TRAIN | 12.1Above Avg | 0.3Very Low |
| UNKNOWN OR OTHER | 2.9Low | 0.7Very Low |
| FUEL/PROPULSION SYSTEM | 1.5Low | 0.5Very Low |
| VEHICLE SPEED CONTROL | 1.3Low | 0.1Very Low |
| FORWARD COLLISION AVOIDANCE | 1.4Low | —None |
| SERVICE BRAKES | 1.2Low | 0.1Very Low |
| EXTERIOR LIGHTING | 0.9Very Low | —None |
| STEERING | 0.7Very Low | 0.2Very Low |
| ENGINE | 0.3Very Low | 0.5Very Low |
| LANE DEPARTURE | 0.7Very Low | —None |
| TIRES | 0.4Very Low | —None |
| AIR BAGS | —None | 0.4Very Low |
| VISIBILITY/WIPER | 0.3Very Low | —None |
| STRUCTURE | —None | 0.2Very Low |
| PARKING BRAKE | 0.1Very Low | —None |
| ENGINE AND ENGINE COOLING | —None | —None |
| BACK OVER PREVENTION | —None | —None |
Complaints per 10,000 units sold, aggregated across all tracked model years from NHTSA owner reports.
How Does Hyundai Ioniq 5 vs Toyota RAV4 Reliability Compare by Year?
| Year | Hyundai Ioniq 5 | Toyota RAV4 | Edge |
|---|---|---|---|
| 2025 | 53/1008R / 158C | 84/1005R / 49C | Toyota RAV4 |
| 2024 | 58/1002R / 134C | 80/1006R / 150C | Toyota RAV4 |
| 2023 | 50/1003R / 311C | 80/1006R / 147C | Toyota RAV4 |
| 2022 | 46/1003R / 349C | 80/1006R / 133C | Toyota RAV4 |
Best years to cross-shop: The 2024 Hyundai Ioniq 5 scored 58/100 and the 2024 Toyota RAV4 scored 80/100 — the strongest shared model years that have been on the road for at least two years, where available.
Who Should Buy the Hyundai Ioniq 5 vs the Toyota RAV4?
Hyundai Ioniq 5 vs Toyota RAV4: Common Questions
- Is the Toyota RAV4 more reliable than the Hyundai Ioniq 5?
- Yes, by a large gap. The RAV4 has a good reliability standing and the Ioniq 5 is mixed. Owners file far fewer complaints per car sold on the RAV4. The Ioniq 5's biggest problem is ICCU failure, which causes sudden power loss and often a dead car.
- Which has more recalls, the RAV4 or the Ioniq 5?
- The RAV4 has more in total, with 53 recalls across 8 model years. The Ioniq 5 has 18 across 5 model years. The RAV4 covers more model years, so its total is larger. Check any specific car's VIN for open recalls before you buy.
- Which costs less to repair, the RAV4 or the Ioniq 5?
- Only the RAV4 has repair-cost data here, so a direct comparison is not possible. The RAV4 averages about $429 a year in repairs and 0.3 unscheduled shop visits. Ten percent of its repairs are major. Ioniq 5 owners report long waits for back-ordered ICCU parts.
- What is the ICCU problem on the Ioniq 5?
- Owners describe a loud pop, then a "check electrical system" warning. The car drops into a power-limited mode, the 12V battery stops charging, and the car often dies, sometimes at highway speed. Failures appear around 22,000 to 25,000 miles and can recur after recall work.
- Which RAV4 years should I avoid?
- Avoid 2019 and 2020, the weakest years in the data. The 2022 model year is among the strongest. The 2025 year is also listed as strong, but it is recent and has had less time to collect complaints, so do not treat it as the safest pick.
Related Reliability Comparisons
More Hyundai Ioniq 5 comparisons
Decided between Hyundai Ioniq 5 and Toyota RAV4? Run a VIN check before you buy — uncover hidden accidents, title issues, and open recalls.
How we score the Hyundai Ioniq 5 and Toyota RAV4
Scores weight complaint severity at 35%, repair costs at 30%, recall impact at 20%, and the spread of complaints across systems at 15%, with complaint counts adjusted for US sales. Read the full methodology.
See incorrect data? Report an issue