Last updated: 2026-10-10
Audi Q5 vs Cadillac XT5: Reliability Compared

Audi Q5
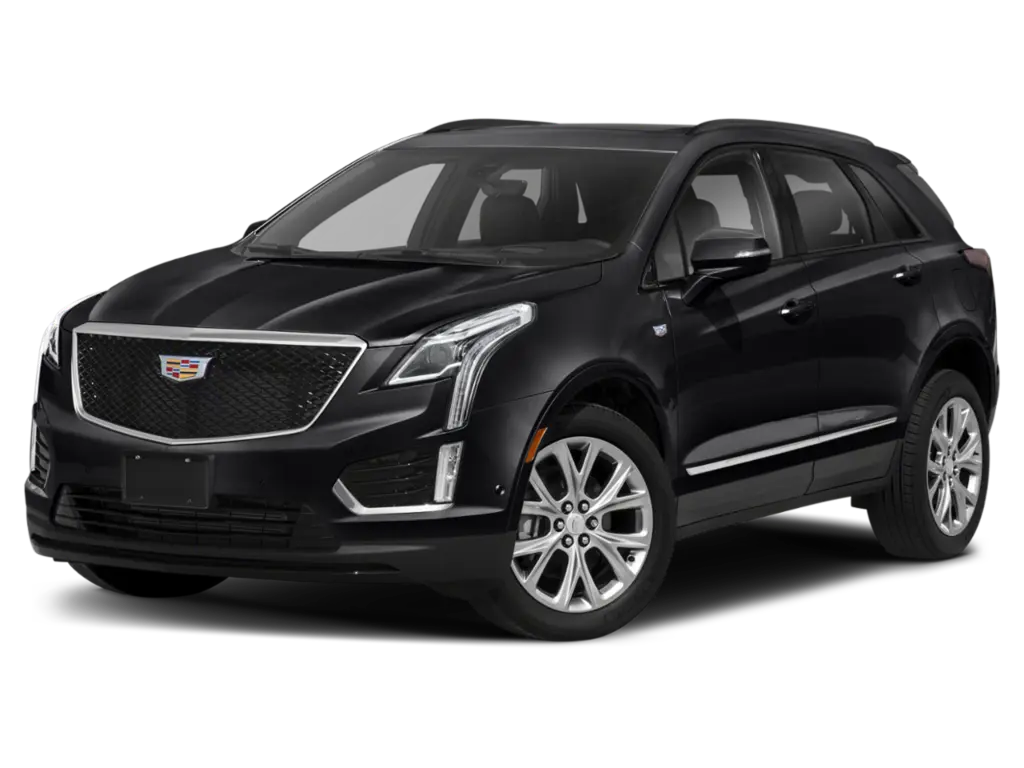
Cadillac XT5
The Cadillac XT5 comes out ahead of the Audi Q5 on reliability, with far fewer owner complaints and recalls. Both rate good, but the gap is clear. The XT5 also needs fewer unscheduled shop visits, at 0.6 a year against 1.2 for the Q5.
How Do the Audi Q5 and Cadillac XT5 Generations Compare?
Verdict
The Cadillac XT5 is more reliable than the Audi Q5, scoring 75/100 vs 69/100.
A clear edge goes to the Cadillac. Owners filed far fewer complaints about it, and it carries far fewer recalls across its model years. It also needs fewer unscheduled shop visits. Both models land in good standing, so the Audi is not a bad pick. But its pile of complaints, and the seriousness of several of them, put it behind. The Cadillac has its own scary failures, including steering assist cutting out and sudden stalls, yet owners report them less often.
Key Differences
- 1Cadillac XT5 costs $121 less per year to repair
- 2Cadillac XT5 has 33 fewer total recalls
- 3Cadillac XT5 has 6.2 fewer complaints per 10k sold
Category Scoreboard
Audi Q5 vs Cadillac XT5: Which Is More Reliable?
| Metric | Audi Q5 | Cadillac XT5 |
|---|---|---|
| Reliability Score | 69/100 | 75/100 |
| Years Tracked | 9 | 8 |
| Total Recalls | 49 | 16 |
| Complaints per 10k Sold | 10.4 | 4.2 |
| Annual Repair Cost | $928/yr | $807/yr |
| Repair Frequency | 1.2/yr | 0.6/yr |
| Year Wins | 1 | 7 |
What Are the Common Problems With the Audi Q5 and Cadillac XT5?
Sudden shutdowns and breakage without warning define the Audi's worst reports. Owners describe a gateway module failure that kills the engine, power steering and brakes at once. Others report rear coil springs snapping with no warning light, and an engine fire on a freeway that injured two people. Crash-linked reports appear in both its power train and steering areas. The Cadillac's issues are narrower. Steering assist drops out and leaves a heavy wheel, transmissions shudder or act like neutral, and engines stall. Its crash-linked reports are fewer and spread thin across several areas.
| Component | Audi Q5 | Cadillac XT5 |
|---|---|---|
| ELECTRICAL SYSTEM | 2.4Low | 0.4Very Low |
| POWER TRAIN | 0.6Very Low | 0.6Very Low |
| STEERING | 0.4Very Low | 0.7Very Low |
| ENGINE | 0.7Very Low | 0.3Very Low |
| UNKNOWN OR OTHER | 0.4Very Low | 0.3Very Low |
| SERVICE BRAKES | 0.4Very Low | 0.2Very Low |
| SUSPENSION | 0.5Very Low | —None |
| VEHICLE SPEED CONTROL | 0.3Very Low | 0.1Very Low |
| AIR BAGS | 0.2Very Low | 0.1Very Low |
| STRUCTURE | 0.2Very Low | 0.1Very Low |
| EXTERIOR LIGHTING | 0.2Very Low | 0.1Very Low |
| FORWARD COLLISION AVOIDANCE | 0.3Very Low | —None |
| LANE DEPARTURE | 0.1Very Low | —None |
| SEAT BELTS | 0.1Very Low | —None |
| WHEELS | —None | 0.1Very Low |
| FUEL/PROPULSION SYSTEM | —None | 0.1Very Low |
| VISIBILITY | —None | 0.1Very Low |
| BACK OVER PREVENTION | —None | 0.1Very Low |
| TIRES | —None | 0.1Very Low |
| SEATS | —None | 0.1Very Low |
| FUEL SYSTEM | —None | —None |
Complaints per 10,000 units sold, aggregated across all tracked model years from NHTSA owner reports.
Which Is Cheaper to Maintain: Audi Q5 or Cadillac XT5?
How Does Audi Q5 vs Cadillac XT5 Reliability Compare by Year?
| Year | Audi Q5 | Cadillac XT5 | Edge |
|---|---|---|---|
| 2026 | 76/1000R / 0C | 81/1000R / 0C | Cadillac XT5 |
| 2025 | 76/1000R / 15C | 74/1001R / 2C | Audi Q5 |
| 2024 | 70/1005R / 26C | 72/1003R / 10C | Cadillac XT5 |
| 2023 | 71/1002R / 6C | 72/1004R / 13C | Cadillac XT5 |
| 2021 | 66/10016R / 126C | 73/1003R / 24C | Cadillac XT5 |
| 2020 | 69/1006R / 22C | 71/1005R / 19C | Cadillac XT5 |
| 2019 | 69/1005R / 40C | 78/1000R / 31C | Cadillac XT5 |
| 2018 | 60/1007R / 197C | 77/1000R / 63C | Cadillac XT5 |
Best years to cross-shop: The 2023 Audi Q5 scored 71/100 and the 2019 Cadillac XT5 scored 78/100 — the strongest shared model years that have been on the road for at least two years, where available.
Who Should Buy the Audi Q5 vs the Cadillac XT5?
Audi Q5 vs Cadillac XT5: Common Questions
- Is the Audi Q5 more reliable than the Cadillac XT5?
- No. The XT5 has a clear edge. Owners filed 162 complaints on it against 471 on the Q5, and the XT5 has fewer recalls. Both stand in good shape, but the Q5 has more serious reports, including sudden shutdowns tied to the gateway module and broken rear springs.
- Which has more recalls, the Q5 or the XT5?
- The Q5 has far more. Federal recall records show 49 recalls across 9 model years for the Q5, against 16 across 8 model years for the XT5. Check any specific car's VIN for open recalls before you buy, since owners report waiting on parts for some Q5 repairs.
- Which costs less to repair, the Q5 or the XT5?
- The XT5 does. Independent repair-cost data estimates $807 a year for the XT5 and $928 for the Q5. That is about $605 less over five years. The XT5 also averages 0.6 unscheduled shop visits a year, compared with 1.2 for the Q5.
- What is the most common Audi Q5 problem?
- Electrical trouble leads, with 110 complaints. Many involve the plug-in Q5 e, where owners say a battery repair is waiting on parts with no timeline. Others describe sudden failures where the SUV stops on a freeway, the dash lights up and the shifter will not go into park.
- Does the Cadillac XT5 have steering problems?
- Yes. Steering is its top complaint area, with 26 reports. Power assist cuts out and leaves the wheel very heavy, at startup or while moving. Restarting the car often brings assist back. Dealers frequently find no stored codes, though one found a steering module software update.
Related Reliability Comparisons
More Audi Q5 comparisons
Decided between Audi Q5 and Cadillac XT5? Run a VIN check before you buy — uncover hidden accidents, title issues, and open recalls.
How we score the Audi Q5 and Cadillac XT5
Scores weight complaint severity at 35%, repair costs at 30%, recall impact at 20%, and the spread of complaints across systems at 15%, with complaint counts adjusted for US sales. Read the full methodology.
See incorrect data? Report an issue