Last updated: 2026-10-10
Honda Ridgeline vs Nissan Frontier: Reliability Compared
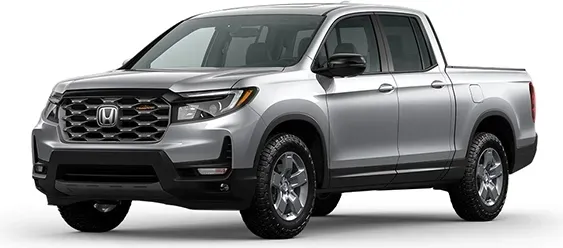
Honda Ridgeline
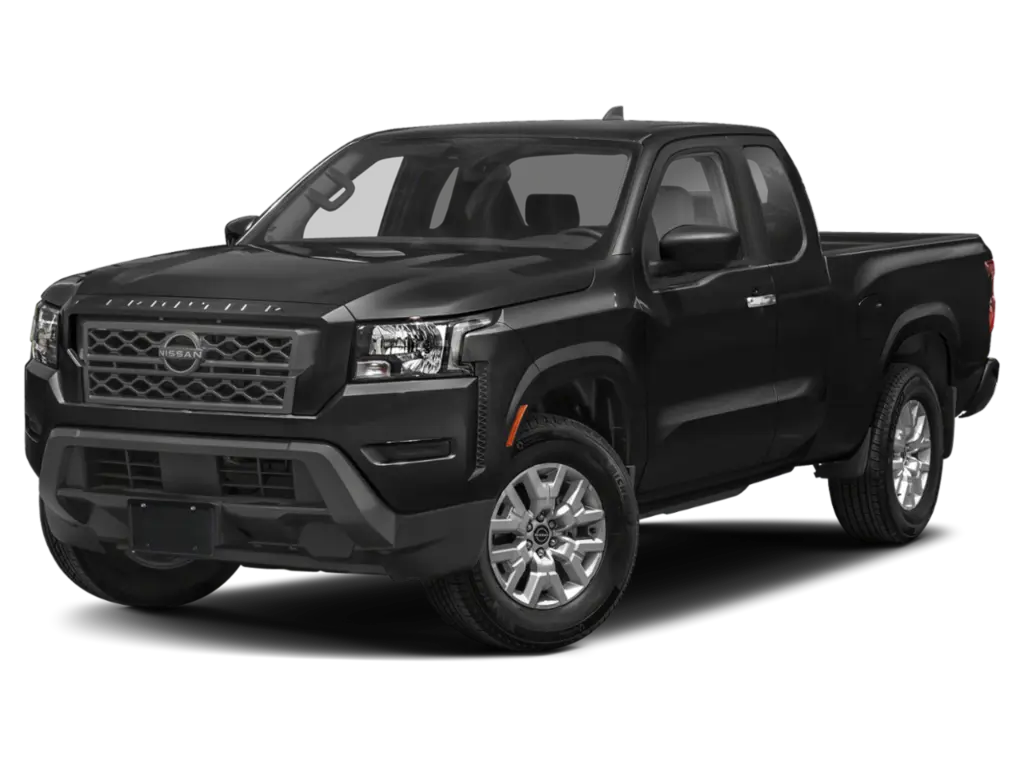
Nissan Frontier
Nissan Frontier edges out Honda Ridgeline on reliability, with far fewer owner complaints. Engine failures weigh on the Ridgeline. The Frontier's main worry is trucks rolling away in Park, and owners filed 92 complaints against 919 for the Ridgeline.
How Do the Honda Ridgeline and Nissan Frontier Generations Compare?
Verdict
The Nissan Frontier is more reliable than the Honda Ridgeline, scoring 80/100 vs 77/100.
Reliability favors the Frontier by a slight margin. Owners filed far fewer complaints about it relative to sales, and federal records show fewer recalls across its model years. The Ridgeline still rates well, but its owner complaints include engine failures that left drivers stranded and a rear camera wiring problem that shows up again and again. The Frontier is not trouble-free. Its roll-away-in-Park reports are serious. Even so, the lower overall volume of problems gives it the edge.
Key Differences
- 1Nissan Frontier has 26 fewer total recalls
- 2Nissan Frontier has 13.5 fewer complaints per 10k sold
- 3Nissan Frontier scores 3 points higher in reliability
Category Scoreboard
Honda Ridgeline vs Nissan Frontier: Which Is More Reliable?
| Metric | Honda Ridgeline | Nissan Frontier |
|---|---|---|
| Reliability Score | 77/100 | 80/100 |
| Years Tracked | 9 | 7 |
| Total Recalls | 35 | 9 |
| Complaints per 10k Sold | 14.2 | 0.7 |
| Safety RatingNHTSA overall | 2026 NHTSA | 2026 NHTSA |
| Frontal | ||
| Side | ||
| Rollover | ||
| Year Wins | 3 | 4 |
What Are the Common Problems With the Honda Ridgeline and Nissan Frontier?
Complaints about the Ridgeline center on a cracking tailgate wiring harness that blacks out the backup camera, erratic automatic high beams, and connecting rod bearing failure that can end with total power loss at highway speed. Transmission judder and hard shifts also appear. Crashes are linked to its electrical, engine and power train areas. Frontier complaints are fewer and more scattered. The main pattern is trucks rolling away in Park, with crashes and an injury reported. Its air bag area also has a crash-linked report with two injuries. The Ridgeline's air bags are not a main problem area.
| Component | Honda Ridgeline | Nissan Frontier |
|---|---|---|
| ELECTRICAL SYSTEM | 2.6Low | 0.1Very Low |
| EXTERIOR LIGHTING | 1.8Low | —None |
| ENGINE | 1.6Low | —None |
| POWER TRAIN | 1.3Low | 0.2Very Low |
| UNKNOWN OR OTHER | 1.3Low | 0.1Very Low |
| BACK OVER PREVENTION | 0.8Very Low | —None |
| FUEL SYSTEM | 0.8Very Low | —None |
| FUEL/PROPULSION SYSTEM | 0.7Very Low | —None |
| SERVICE BRAKES | 0.5Very Low | 0.1Very Low |
| STRUCTURE | 0.5Very Low | —None |
| FORWARD COLLISION AVOIDANCE | 0.4Very Low | —None |
| AIR BAGS | 0.2Very Low | —None |
| VISIBILITY/WIPER | 0.2Very Low | —None |
| VEHICLE SPEED CONTROL | 0.1Very Low | —None |
| STEERING | 0.1Very Low | —None |
| ENGINE AND ENGINE COOLING | —None | —None |
| SEAT BELTS | —None | —None |
| SUSPENSION | —None | —None |
Complaints per 10,000 units sold, aggregated across all tracked model years from NHTSA owner reports.
How Does Honda Ridgeline vs Nissan Frontier Reliability Compare by Year?
| Year | Honda Ridgeline | Nissan Frontier | Edge |
|---|---|---|---|
| 2026 | 86/1000R / 2C | 77/1001R / 2C | Honda Ridgeline |
| 2025 | 85/1001R / 42C | 84/1000R / 0C | Honda Ridgeline |
| 2024 | 85/1001R / 41C | 77/1003R / 14C | Honda Ridgeline |
| 2021 | 75/1005R / 90C | 84/1000R / 0C | Nissan Frontier |
| 2020 | 70/1007R / 158C | 78/1002R / 20C | Nissan Frontier |
| 2019 | 65/10010R / 222C | 80/1001R / 31C | Nissan Frontier |
| 2018 | 70/1006R / 153C | 79/1002R / 25C | Nissan Frontier |
Best years to cross-shop: The 2024 Honda Ridgeline scored 85/100 and the 2021 Nissan Frontier scored 84/100 — the strongest shared model years that have been on the road for at least two years, where available.
Who Should Buy the Honda Ridgeline vs the Nissan Frontier?
Honda Ridgeline vs Nissan Frontier: Common Questions
- Is the Honda Ridgeline more reliable than the Nissan Frontier?
- No. The Frontier has a slight edge. It drew 92 owner complaints against 919 for the Ridgeline, and its recall count is lower. The Ridgeline still has a good standing, but its engine and backup camera problems appear more often than anything on the Frontier list.
- Which has more recalls, the Ridgeline or the Frontier?
- The Ridgeline has more. Federal recall records show 35 recalls across 9 Ridgeline model years and 9 recalls across 7 Frontier model years. Check any specific truck's VIN with a dealer or federal lookup to see whether recall repairs were completed.
- What is the biggest problem with the Nissan Frontier?
- Rolling away while in Park is the main pattern in the power train complaints. Three of those reports involve a crash, with one injury. Some owners said dealers had no parts for the recall repair. Confirm that work is finished before you buy.
- What goes wrong with the Honda Ridgeline backup camera?
- The wiring harness to the tailgate cracks, frays and snaps where it bends as the tailgate opens. The screen goes black or works only on and off. Failures cluster between roughly 26,000 and 50,000 miles, and one camera failure is tied to a crash.
- Which Ridgeline and Frontier years should I avoid?
- On the Ridgeline, avoid 2019 and 2020, its weakest years. On the Frontier, avoid 2024, which is among its weakest. The Frontier's 2021 is its strongest year, so start your search there.
Related Reliability Comparisons
More Honda Ridgeline comparisons
Decided between Honda Ridgeline and Nissan Frontier? Run a VIN check before you buy — uncover hidden accidents, title issues, and open recalls.
How we score the Honda Ridgeline and Nissan Frontier
Scores weight complaint severity at 35%, repair costs at 30%, recall impact at 20%, and the spread of complaints across systems at 15%, with complaint counts adjusted for US sales. Read the full methodology.
See incorrect data? Report an issue