Last updated: 2026-10-10
Chevrolet Bolt vs Kia Niro: Reliability Compared
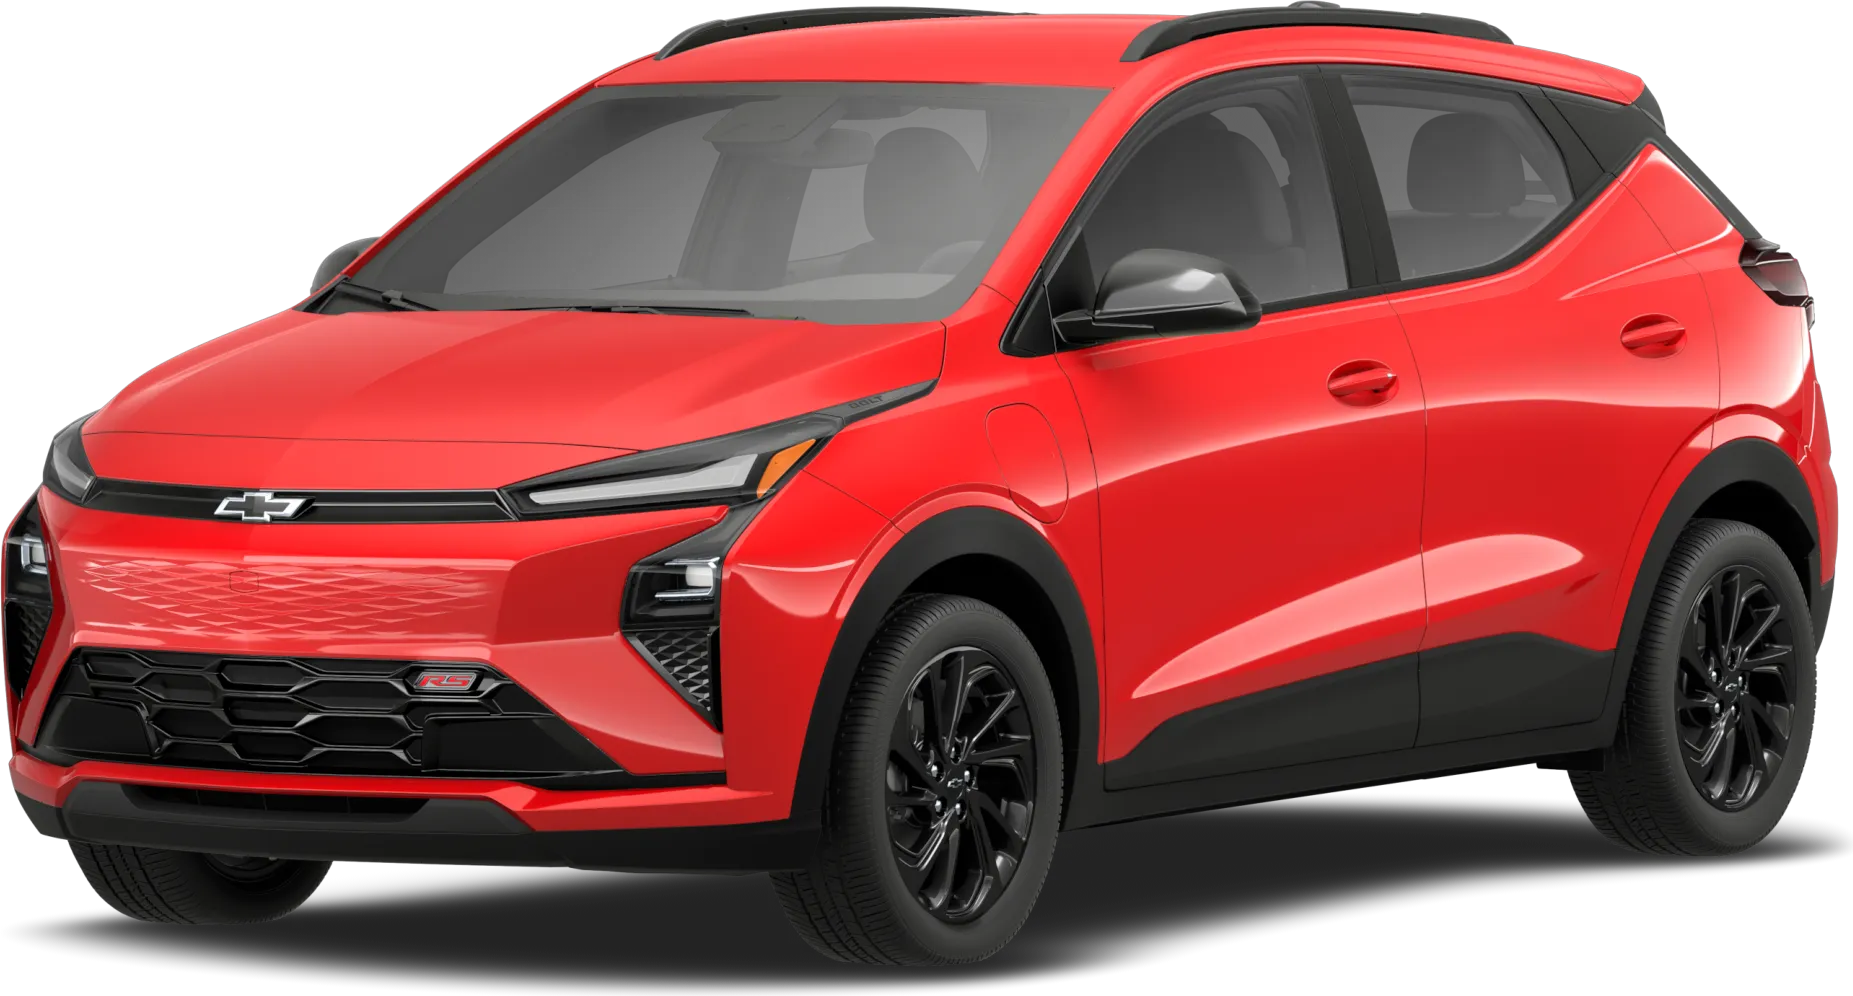
Chevrolet Bolt
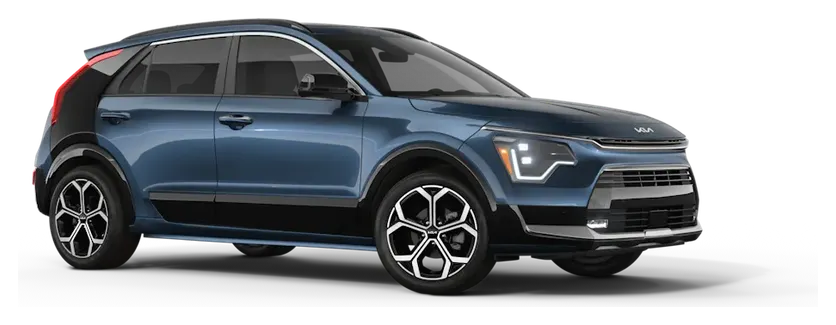
Kia Niro
Reliability favors the KIA Niro by a wide margin over the Chevrolet Bolt. The Bolt has 30 recalls to the Niro's 2. Bolt owners also report battery fire limits and sudden power loss, while the Niro's 2024 and 2025 years have drawn few complaints.
How Do the Chevrolet Bolt and Kia Niro Generations Compare?
Chevrolet Bolt vs Kia Niro: Which Is More Reliable?
| Metric | Chevrolet Bolt | Kia Niro |
|---|---|---|
| Reliability Score | 59/100 | 80/100 |
| Years Tracked | 5 | 2 |
| Total Recalls | 30 | 2 |
| Complaints per 10k Sold | 24.5 | 4.1 |
| Safety RatingNHTSA overall | 2023 NHTSA | 2025 NHTSA |
| Frontal | ||
| Side | ||
| Rollover |
What Are the Common Problems With the Chevrolet Bolt and Kia Niro?
Serious, repeating failures define the Bolt's complaints. Battery fire risk led owners to cap charging at 90 percent and park outside, often while waiting a long time for parts. Others report steering that binds and loses power assist, cars that lose propulsion at speed, and automatic braking that fires with nothing ahead. Crash-linked reports sit in the electrical, power train, and forward collision areas. Niro reports are rare: total electrical power loss, driver-assist systems that did not react to traffic, and a rack and pinion noise. Its crash-linked reports sit only in electrical and forward collision avoidance.
| Component | Chevrolet Bolt | Kia Niro |
|---|---|---|
| ELECTRICAL SYSTEM | 8.7Above Avg | 0.5Very Low |
| STEERING | 4.8Average | —None |
| UNKNOWN OR OTHER | 1.4Low | 1.5Low |
| POWER TRAIN | 2.4Low | —None |
| FUEL/PROPULSION SYSTEM | 1.6Low | —None |
| FORWARD COLLISION AVOIDANCE | 0.9Very Low | 0.3Very Low |
| VEHICLE SPEED CONTROL | 0.7Very Low | —None |
| EXTERIOR LIGHTING | 0.7Very Low | —None |
| SERVICE BRAKES | 0.6Very Low | —None |
| AIR BAGS | 0.5Very Low | —None |
| SUSPENSION | —None | 0.3Very Low |
| VISIBILITY/WIPER | 0.2Very Low | —None |
| BACK OVER PREVENTION | 0.1Very Low | —None |
| TIRES | 0.1Very Low | —None |
| SEAT BELTS | 0.1Very Low | —None |
Complaints per 10,000 units sold, aggregated across all tracked model years from NHTSA owner reports.
Who Should Buy the Chevrolet Bolt vs the Kia Niro?
Chevrolet Bolt vs Kia Niro: Common Questions
- Is the Chevrolet Bolt more reliable than the KIA Niro?
- No. The Niro rates well ahead of the Bolt. Bolt owners filed 531 complaints, about 24.5 per 10,000 sold, against 25 for the Niro at about 4.1 per 10,000. The Bolt's reports include battery fire limits, steering binding, and loss of drive at speed. The Niro has had less time on the road, though.
- Which has more recalls, the Bolt or the Niro?
- The Bolt has far more. Federal recall records show 30 recalls across five Bolt model years, compared with 2 across two Niro model years. The Niro's model years are newer, so it has had less time to collect recalls, but the gap is still wide.
- What is the biggest problem with the Chevrolet Bolt?
- Battery fire risk is the largest issue. Owners describe waiting a long time, in some cases almost 2 years, for replacement battery parts. They cap charging at 90 percent, park away from buildings, and lose range. Steering binding and sudden propulsion loss are also common complaints.
- Which Bolt model years should I avoid?
- Avoid 2019 and 2018, the weakest Bolt years in the data. The strongest are 2023 and 2021. Whatever year you consider, make sure every recall is completed and test the steering for binding before you buy.
- Are the Niro's driver-assist systems a concern?
- They drew a few complaints, so stay alert. One crash report says the front collision sensor gave no warning at night. Another says adaptive cruise held 45 mph while closing on slower traffic with no braking. Bolt owners report the opposite problem: automatic braking with nothing ahead.
Related Reliability Comparisons
More Chevrolet Bolt comparisons
Decided between Chevrolet Bolt and Kia Niro? Run a VIN check before you buy — uncover hidden accidents, title issues, and open recalls.
How we score the Chevrolet Bolt and Kia Niro
Scores weight complaint severity at 35%, repair costs at 30%, recall impact at 20%, and the spread of complaints across systems at 15%, with complaint counts adjusted for US sales. Read the full methodology.
See incorrect data? Report an issue