Last updated: 2026-10-10
Ford Ranger vs Hyundai Santa Cruz: Reliability Compared

Ford Ranger
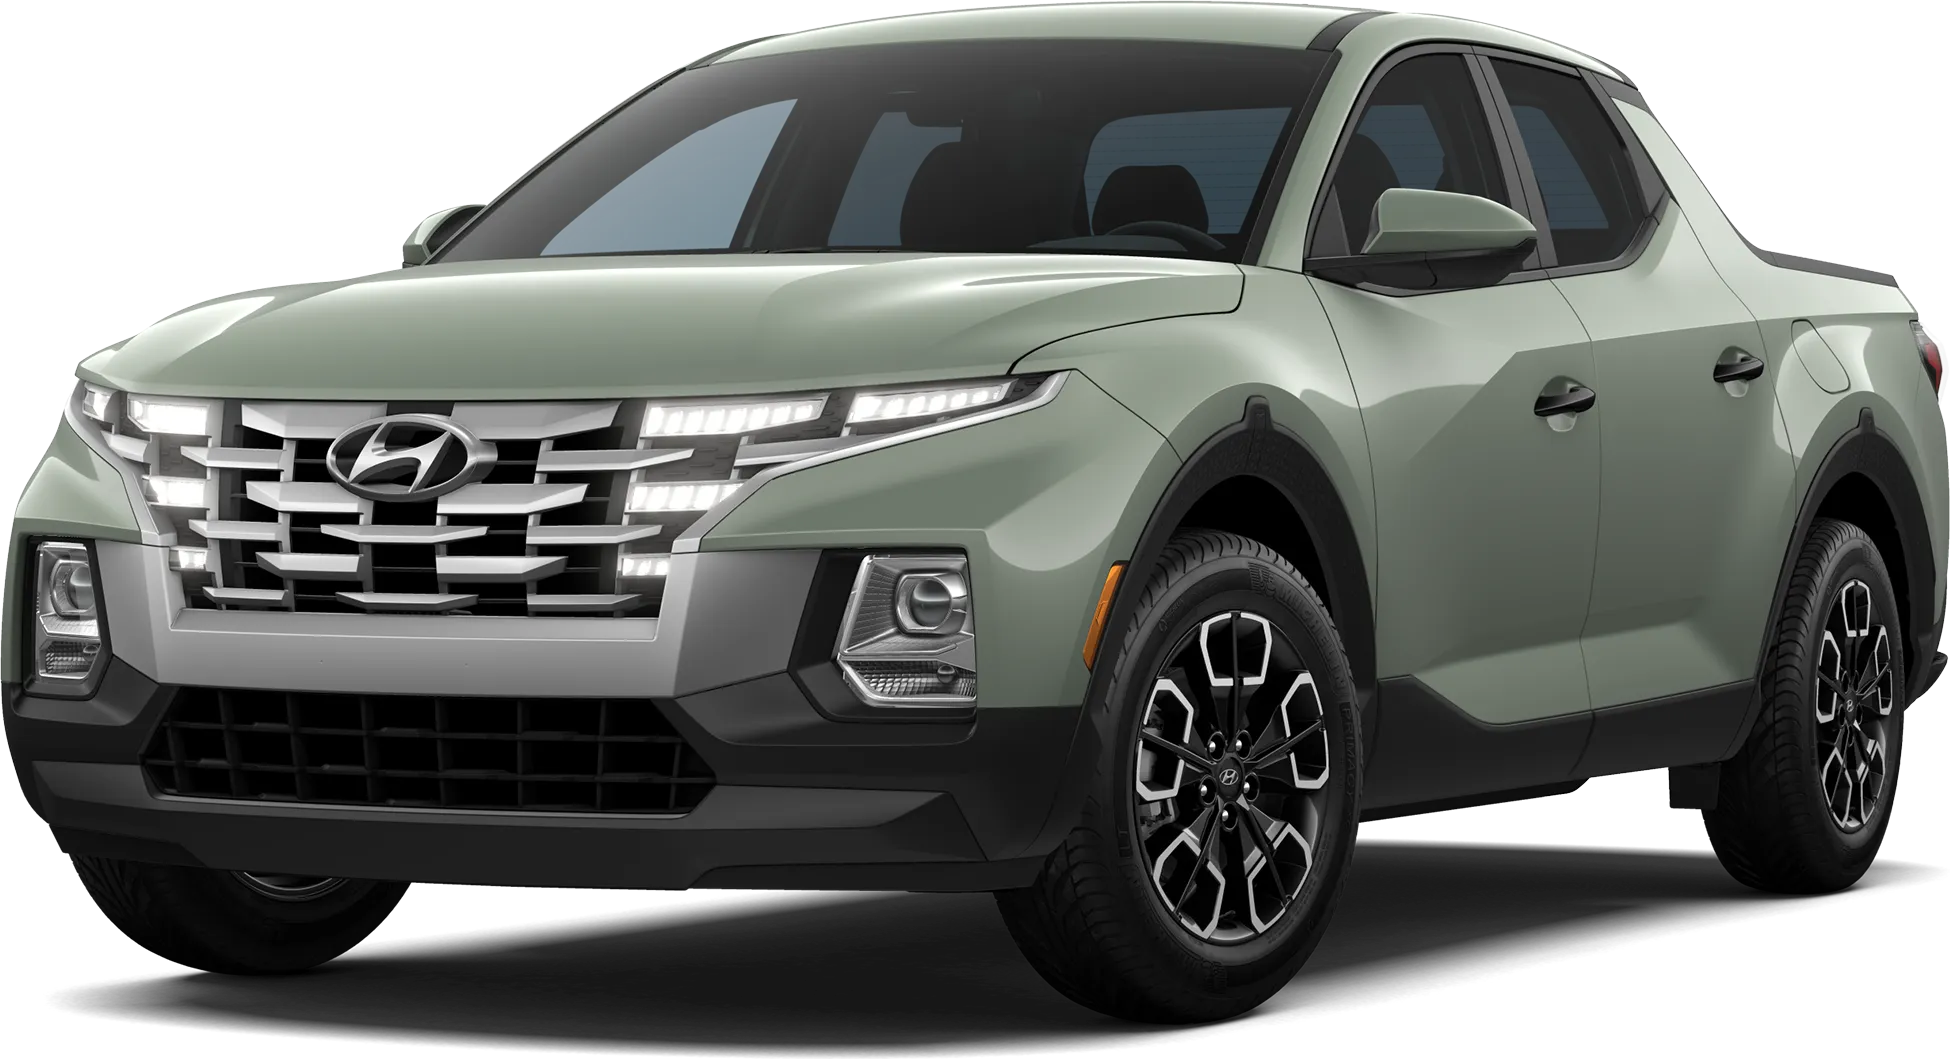
Hyundai Santa Cruz
Reliability favors the Ford Ranger over the Hyundai Santa-Cruz by a clear margin. Ranger owners file far fewer complaints per truck sold. The Santa-Cruz is led by sudden power loss and transmission trouble, while the Ranger carries many more recalls.
How Do the Ford Ranger and Hyundai Santa Cruz Generations Compare?
Verdict
The Ford Ranger is more reliable than the Hyundai Santa Cruz, scoring 73/100 vs 68/100.
A clear edge goes to the Ford Ranger. The deciding factor is complaint volume: 5.1 complaints per 10,000 sold, against 20.2 for the Hyundai Santa-Cruz. The Santa-Cruz's main failure, sudden power loss with a transmission that stops shifting, is harder to live with than anything common on the Ranger's list. The Ranger does carry far more recalls, and its crash-linked complaints are a real concern. Even so, the broader record favors it.
Key Differences
- 1Hyundai Santa Cruz has 41 fewer total recalls
- 2Ford Ranger has 15.1 fewer complaints per 10k sold
- 3Ford Ranger scores 5 points higher in reliability
Category Scoreboard
Ford Ranger vs Hyundai Santa Cruz: Which Is More Reliable?
| Metric | Ford Ranger | Hyundai Santa Cruz |
|---|---|---|
| Reliability Score | 73/100 | 68/100 |
| Years Tracked | 8 | 5 |
| Total Recalls | 52 | 11 |
| Complaints per 10k Sold | 5.1 | 20.2 |
| Safety RatingNHTSA overall | 2026 NHTSA | 2026 NHTSA |
| Frontal | ||
| Side | ||
| Rollover | ||
| Year Wins | 5 | 0 |
What Are the Common Problems With the Ford Ranger and Hyundai Santa Cruz?
Power train problems lead on both trucks, but they look different. Ranger owners report the drive mode selector switching modes on its own at speed, plus occasional neutral drops. Santa-Cruz owners report sudden power loss while merging, limp mode, and replacement transmissions. The Ranger also has crash-linked complaints in electrical (throttle going dead, false automatic braking) and service brakes, where the Santa-Cruz has none. Both have crash-linked power train complaints, with more on the Ranger. Santa-Cruz engine trouble centers on failing fuel injectors and misfires. Its other complaints involve weak low beams and a driver attention camera that shuts off cruise control.
| Component | Ford Ranger | Hyundai Santa Cruz |
|---|---|---|
| POWER TRAIN | 1.7Low | 8.1Above Avg |
| ELECTRICAL SYSTEM | 0.6Very Low | 1.9Low |
| UNKNOWN OR OTHER | 0.3Very Low | 1.8Low |
| ENGINE | 0.2Very Low | 1.7Low |
| EXTERIOR LIGHTING | 0.2Very Low | 0.8Very Low |
| VEHICLE SPEED CONTROL | 0.2Very Low | 0.6Very Low |
| FORWARD COLLISION AVOIDANCE | —None | 0.8Very Low |
| SERVICE BRAKES | 0.4Very Low | 0.3Very Low |
| AIR BAGS | 0.1Very Low | 0.5Very Low |
| FUEL/PROPULSION SYSTEM | —None | 0.6Very Low |
| TRAILER HITCHES | —None | 0.3Very Low |
| VISIBILITY | 0.2Very Low | —None |
| STRUCTURE | 0.1Very Low | 0.1Very Low |
| SUSPENSION | 0.1Very Low | —None |
| SEATS | 0.1Very Low | —None |
| STEERING | —None | 0.1Very Low |
| VISIBILITY/WIPER | —None | 0.1Very Low |
| SEAT BELTS | —None | —None |
| ENGINE AND ENGINE COOLING | —None | —None |
Complaints per 10,000 units sold, aggregated across all tracked model years from NHTSA owner reports.
How Does Ford Ranger vs Hyundai Santa Cruz Reliability Compare by Year?
| Year | Ford Ranger | Hyundai Santa Cruz | Edge |
|---|---|---|---|
| 2026 | 83/1001R / 0C | 74/1002R / 0C | Ford Ranger |
| 2025 | 74/1008R / 11C | 72/1002R / 15C | Ford Ranger |
| 2024 | 72/10010R / 44C | 71/1001R / 30C | Ford Ranger |
| 2023 | 73/1004R / 16C | 64/1002R / 73C | Ford Ranger |
| 2022 | 75/1005R / 34C | 57/1004R / 171C | Ford Ranger |
Best years to cross-shop: The 2022 Ford Ranger scored 75/100 and the 2024 Hyundai Santa Cruz scored 71/100 — the strongest shared model years that have been on the road for at least two years, where available.
Who Should Buy the Ford Ranger vs the Hyundai Santa Cruz?
Ford Ranger vs Hyundai Santa Cruz: Common Questions
- Is the Ford Ranger more reliable than the Hyundai Santa-Cruz?
- Yes, the Ranger has a clear edge. Owners file 5.1 complaints per 10,000 Rangers sold, compared with 20.2 per 10,000 Santa-Cruz trucks. The Santa-Cruz's most serious pattern is sudden power loss with transmission trouble, which has led to replacement transmissions on several trucks.
- Which has more recalls, the Ranger or the Santa-Cruz?
- The Ranger has more. Federal recall records show 52 recalls across its 8 model years, against 11 across the Santa-Cruz's 5 model years. The Ranger has been on sale longer, so check any specific truck's VIN for open recalls before buying.
- Which Ranger and Santa-Cruz years should I avoid?
- For the Ranger, avoid 2019 and 2020, its weakest years. For the Santa-Cruz, avoid 2022 and 2023. The newest years of each look strong, but they have had less time to collect complaints, so that is not proof they are better.
- What is the biggest problem with the Hyundai Santa-Cruz?
- Power train trouble is the biggest. Owners describe sudden power loss when merging, a transmission that stops shifting or enters limp mode, and replacement transmissions, some before 20,000 miles. Dealers often could not reproduce the fault. Fuel injector misfires are a further problem.
- Are there crash-linked complaints on the Ranger that the Santa-Cruz lacks?
- Yes. The Ranger has crash-linked complaints in electrical and service brakes, including a throttle that went dead briefly and an ABS event on a snowy road. Both trucks have crash-linked power train complaints, though the Ranger has more of them.
Related Reliability Comparisons
More Ford Ranger comparisons
More Hyundai Santa Cruz comparisons
Decided between Ford Ranger and Hyundai Santa Cruz? Run a VIN check before you buy — uncover hidden accidents, title issues, and open recalls.
How we score the Ford Ranger and Hyundai Santa Cruz
Scores weight complaint severity at 35%, repair costs at 30%, recall impact at 20%, and the spread of complaints across systems at 15%, with complaint counts adjusted for US sales. Read the full methodology.
See incorrect data? Report an issue