Last updated: 2026-11-20
BMW X5 vs Rivian R1S: Reliability Compared
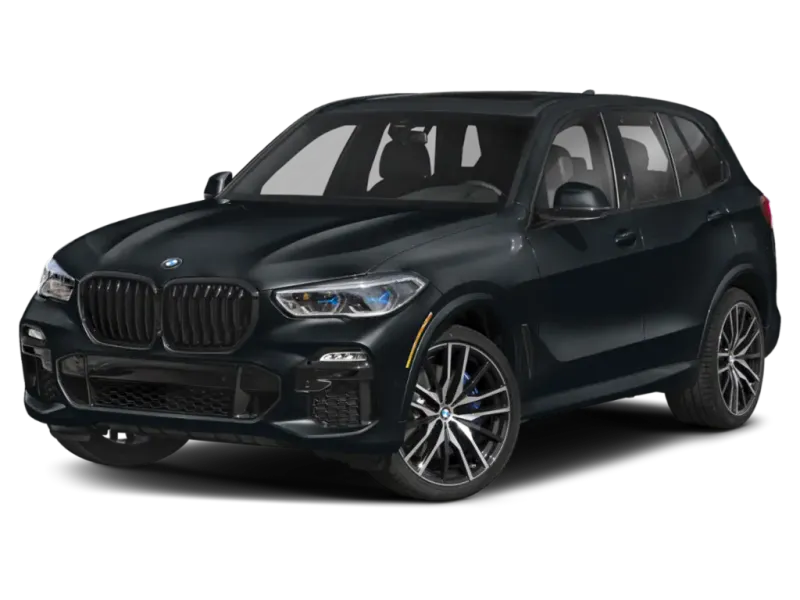 BMW X5
 Rivian R1S
The X5 takes 2 of 3 rounds
Choosing between the BMW X5 and the Rivian R1S? This page compares their reliability scores, NHTSA recall history, owner-reported complaints, and estimated annual repair costs so you can make a confident long-term ownership decision between these two midsize suvs.
Our reliability scores are based on NHTSA recall and complaint data, independent repair cost estimates, and sales-normalized complaint rates. The BMW X5 currently leads with an average score of 58/100 compared to 57/100. Scroll down for the full year-by-year breakdown, common problem areas, and repair cost comparison.
Verdict
The BMW X5 is more reliable than the Rivian R1S, scoring 58/100 vs 57/100.
Biggest gaps
- BMW X5 has 18.1 fewer complaints per 10k sold
- Rivian R1S has 38 fewer total recalls
- BMW X5 scores 1 points higher in reliability
Round by round
- Reliability ScoreX5
- Total RecallsR1S
- Complaint RateX5
Leaning BMW X5 or Rivian R1S? Check the exact car before you buy
Whichever wins on paper, the car in front of you has its own past. A VIN check shows its accidents, title history and any open recalls.
BMW X5 vs Rivian R1S: Which Is More Reliable?
| Metric | BMW X5 | Rivian R1S |
|---|---|---|
| Reliability ScoreOut of 100, higher is better | 58/100 | 57/100 |
| Years Tracked | 9 | 4 |
| Total RecallsLower is better | 63 | 25 |
| Complaints per 10k SoldLower is better | 8.3 | 26.4 |
| Year WinsModel years with the higher score | 2 | 2 |
What Are the Common Problems With the BMW X5 and Rivian R1S?
| BMW X5 | Problem area | Rivian R1S |
|---|---|---|
0.3 | Airbags | 5.3 |
1.8 | Electrical | 3.2 |
0.9 | Brakes | 1.0 |
<0.1 | Suspension | 1.5 |
<0.1 | Automatic emergency braking | 1.3 |
0.2 | Steering | 1.1 |
1.2 | Engine | 0 |
<0.1 | Headlights and exterior lights | 1.1 |
<0.1 | Acceleration and cruise control | 1.0 |
<0.1 | Wipers and visibility | 1.0 |
0.8 | Transmission | 0 |
0.6 | Stability control | 0 |
<0.1 | Wheels and tires | 0.5 |
0.2 | Body and structure | 0.3 |
0 | Door latches and locks | 0.5 |
0 | Seat belts | 0.3 |
0.2 | Backup camera | 0 |
0.1 | Fuel system | 0 |
<0.1 | Lane keeping | 0 |
0.6 | Other or unspecified | 2.9 |
Complaints per 10,000 units sold, aggregated across all tracked model years from NHTSA owner reports. Shorter bars mean fewer complaints.
BMW X5 problem guides
How Does BMW X5 vs Rivian R1S Reliability Compare by Year?
| Year | BMW X5 | Rivian R1S | Edge |
|---|---|---|---|
| 2026 | 56/1004 recalls · 32 complaints | 59/1001 recall · 14 complaints | R1S+3 |
| 2025 | 63/1004 recalls · 63 complaints | 55/1009 recalls · 55 complaints | X5+8 |
| 2024 | 56/1007 recalls · 147 complaints | 61/1006 recalls · 19 complaints | R1S+5 |
| 2023 | 64/1004 recalls · 35 complaints | 54/1009 recalls · 76 complaints | X5+10 |
Best years to cross-shop: The 2023 BMW X5 scored 64/100 and the 2024 Rivian R1S scored 61/100, the strongest shared model years that have been on the road for at least two years, where available.
BMW X5 vs Rivian R1S: Common Questions
- Is the BMW X5 more reliable than the Rivian R1S?
- Based on our data, the BMW X5 is more reliable with an average score of 58/100 compared to 57/100. The difference is modest, so both are reasonable choices.
- Which has more recalls, the BMW X5 or the Rivian R1S?
- The BMW X5 has more recalls (63) compared to the Rivian R1S (25). More recalls don't always mean worse reliability — some are minor — but it's worth reviewing what each recall covers.
- Which has fewer owner complaints, the BMW X5 or the Rivian R1S?
- Adjusted for sales volume, the BMW X5 has a lower complaint rate at 8.3 per 10,000 vehicles sold versus 26.4 for the Rivian R1S. Normalizing by sales gives a fairer comparison than raw totals.
Related Reliability Comparisons
More BMW X5 comparisons
Decided between BMW X5 and Rivian R1S? Run a VIN check before you buy — uncover hidden accidents, title issues, and open recalls.
How we score the BMW X5 and Rivian R1S
Scores weight complaint severity at 35%, repair costs at 30%, recall impact at 20%, and the spread of complaints across systems at 15%, with complaint counts adjusted for US sales. Read the full methodology.
See incorrect data? Report an issue