Last updated: 2026-10-10
Acura ZDX vs Volvo XC90: Reliability Compared
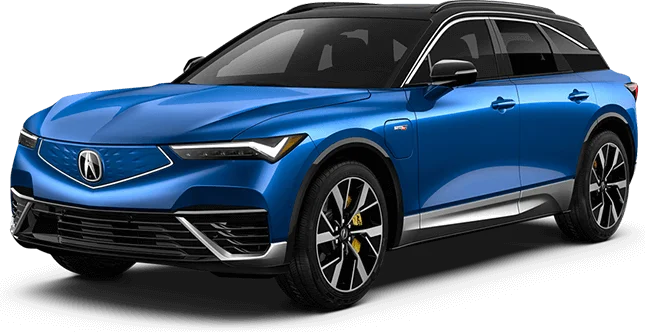
Acura ZDX

Volvo XC90
Reliability favors the Acura ZDX over the Volvo XC90 by a wide margin. The deciding fact is severity: XC90 owners report brake loss and engine shutdowns, with crashes linked to five problem areas, while the ZDX has one crash-linked area. Its sudden-braking complaints still deserve a close look.
How Do the Acura ZDX and Volvo XC90 Generations Compare?
Verdict
The Acura ZDX is more reliable than the Volvo XC90, scoring 82/100 vs 72/100.
Reliability favors the Acura ZDX by a large margin, and its standing is excellent against a good standing for the Volvo XC90. The deciding factor is the XC90's record of serious failures: brake pedals that lose stopping power, engine shutdowns, and instrument clusters that go dark on the highway. Crashes are linked to five of its problem areas. The ZDX has one crash-linked area. Its weak spot is a high complaint rate per car sold, mostly about braking systems acting on their own. It has only two model years of history, so the picture is still forming.
Key Differences
- 1Volvo XC90 has 69.4 fewer complaints per 10k sold
- 2Acura ZDX has 35 fewer total recalls
- 3Acura ZDX scores 10 points higher in reliability
Category Scoreboard
Acura ZDX vs Volvo XC90: Which Is More Reliable?
| Metric | Acura ZDX | Volvo XC90 |
|---|---|---|
| Reliability Score | 82/100 | 72/100 |
| Years Tracked | 2 | 9 |
| Total Recalls | 4 | 39 |
| Complaints per 10k Sold | 73.6 | 4.2 |
| Safety RatingNHTSA overall | 2025 NHTSA | 2026 NHTSA |
| Frontal | ||
| Side | ||
| Rollover | ||
| Year Wins | 2 | 0 |
What Are the Common Problems With the Acura ZDX and Volvo XC90?
Mechanical and electrical failures define the XC90's record. Owners report the digital instrument cluster going dark while driving, sunroof leaks, brake pedals losing all stopping power, limp mode, and engines cutting out. Crashes are linked to brakes, power train, electrical, back over prevention, and engine. The ZDX's complaints center on driver-assist braking: sudden stops with nothing ahead, reverse braking that sets the parking brake, and a pedal that sinks. Dealers often cannot reproduce these faults. Its only crash-linked area is power train, where a car rolled backward after being put in Park.
| Component | Acura ZDX | Volvo XC90 |
|---|---|---|
| SERVICE BRAKES | 21.3High | 0.4Very Low |
| UNKNOWN OR OTHER | 13.1Above Avg | 0.5Very Low |
| ELECTRICAL SYSTEM | 11.5Above Avg | 1.1Low |
| FORWARD COLLISION AVOIDANCE | 11.5Above Avg | —None |
| BACK OVER PREVENTION | 4.9Average | 0.3Very Low |
| POWER TRAIN | 3.3Average | 0.2Very Low |
| ENGINE | —None | 0.2Very Low |
| VISIBILITY/WIPER | —None | 0.1Very Low |
| LATCHES/LOCKS/LINKAGES | —None | 0.1Very Low |
| STEERING | —None | 0.1Very Low |
| STRUCTURE | —None | 0.1Very Low |
| FUEL/PROPULSION SYSTEM | —None | 0.1Very Low |
Complaints per 10,000 units sold, aggregated across all tracked model years from NHTSA owner reports.
How Does Acura ZDX vs Volvo XC90 Reliability Compare by Year?
| Year | Acura ZDX | Volvo XC90 | Edge |
|---|---|---|---|
| 2025 | 88/1000R / 0C | 74/1003R / 23C | Acura ZDX |
| 2024 | 76/1004R / 45C | 73/1003R / 26C | Acura ZDX |
Best years to cross-shop: The 2024 Acura ZDX scored 76/100 and the 2024 Volvo XC90 scored 73/100 — the strongest shared model years that have been on the road for at least two years, where available.
Who Should Buy the Acura ZDX vs the Volvo XC90?
Acura ZDX vs Volvo XC90: Common Questions
- Is the Volvo XC90 more reliable than the Acura ZDX?
- No. The Acura ZDX leads by a large gap, with an excellent standing against a good one for the XC90. The XC90 has more serious reports, including brake pedal loss, engine shutdowns, and a dark instrument cluster. The ZDX has only two model years of data, so its record is short.
- Which has more recalls, the XC90 or the ZDX?
- The XC90 has far more recalls in total: 39 across 9 model years, against 4 across the ZDX's 2 model years. The XC90 has been on sale far longer, so more recalls are expected. Check any specific car's VIN for open recall work before buying.
- Which costs less to repair, the XC90 or the ZDX?
- The data does not allow a fair comparison. Independent repair-cost data exists for the XC90, which shows an estimated $851 a year, but not for the ZDX. With only two ZDX model years on the road, long-term repair costs are not yet known.
- What are the most common problems with the Acura ZDX?
- Braking is the biggest area, with 13 complaints. Owners describe a pedal that sinks, Service Brake Assist warnings, and the car braking or setting the parking brake on its own. Forward collision avoidance and electrical faults each have 7 complaints. Dealers often find no stored codes.
- Are there safety concerns with the Volvo XC90?
- Yes, mainly brakes. Service brake complaints include 3 crash-linked reports, among them a pedal losing stopping power at about 60,000 and 70,000 miles. Power train complaints include 2 crash-linked reports of limp mode. Test the brakes and cluster, and avoid the 2019 and 2023 model years.
Related Reliability Comparisons
More Acura ZDX comparisons
Decided between Acura ZDX and Volvo XC90? Run a VIN check before you buy — uncover hidden accidents, title issues, and open recalls.
How we score the Acura ZDX and Volvo XC90
Scores weight complaint severity at 35%, repair costs at 30%, recall impact at 20%, and the spread of complaints across systems at 15%, with complaint counts adjusted for US sales. Read the full methodology.
See incorrect data? Report an issue