Last updated: 2026-10-10
Mazda CX-90 vs Subaru Ascent: Reliability Compared
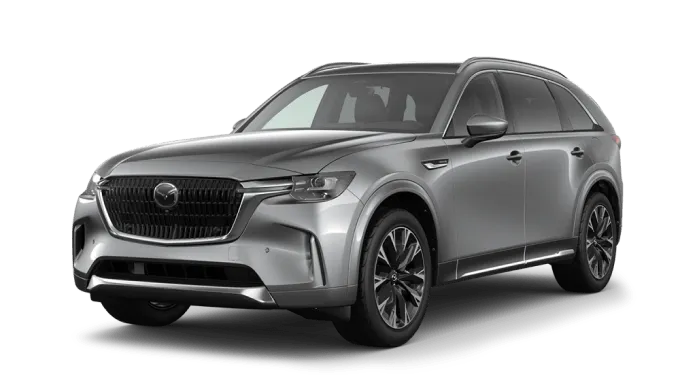
Mazda CX-90
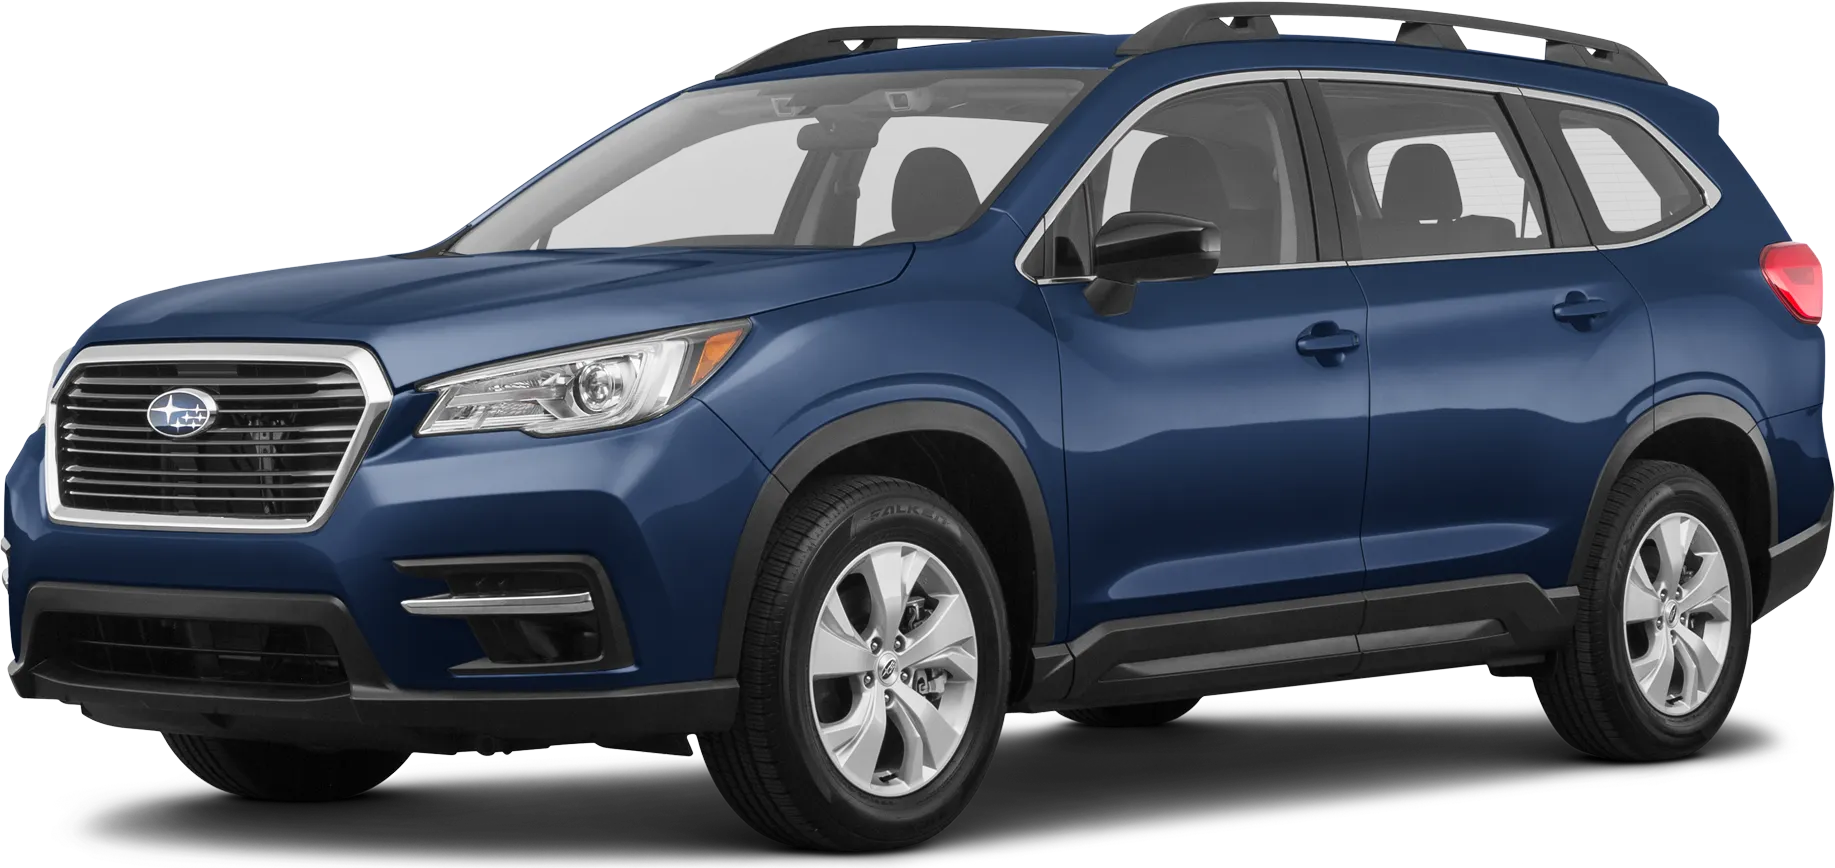
Subaru Ascent
Choosing between the Mazda CX-90 and the Subaru Ascent? This page compares their reliability scores, NHTSA recall history, owner-reported complaints, and estimated annual repair costs so you can make a confident long-term ownership decision between these two midsize suvs.
Our reliability scores are based on NHTSA recall and complaint data, independent repair cost estimates, and sales-normalized complaint rates. The Subaru Ascent currently leads with an average score of 69/100 compared to 58/100. Scroll down for the full year-by-year breakdown, common problem areas, and repair cost comparison.
Verdict
The Subaru Ascent is more reliable than the Mazda CX-90, scoring 69/100 vs 58/100.
Key Differences
- 1Subaru Ascent has 102.0 fewer complaints per 10k sold
- 2Subaru Ascent scores 11 points higher in reliability
- 3Mazda CX-90 has 3 fewer total recalls
Category Scoreboard
Mazda CX-90 vs Subaru Ascent: Which Is More Reliable?
| Metric | Mazda CX-90 | Subaru Ascent |
|---|---|---|
| Reliability Score | 58/100 | 69/100 |
| Years Tracked | 3 | 7 |
| Total Recalls | 13 | 16 |
| Complaints per 10k Sold | 111.2 | 9.2 |
| Safety RatingNHTSA overall | 2026 NHTSA | 2026 NHTSA |
| Frontal | ||
| Side | ||
| Rollover | ||
| Year Wins | 0 | 3 |
What Are the Common Problems With the Mazda CX-90 and Subaru Ascent?
| Component | Mazda CX-90 | Subaru Ascent |
|---|---|---|
| STEERING | 31.8High | —None |
| ELECTRICAL SYSTEM | 17.5High | 2.7Low |
| FORWARD COLLISION AVOIDANCE | 11.5Above Avg | 0.1Very Low |
| POWER TRAIN | 8.3Above Avg | 1.5Low |
| UNKNOWN OR OTHER | 8.7Above Avg | 1Very Low |
| ENGINE | 6.8Average | 0.3Very Low |
| VEHICLE SPEED CONTROL | 6.4Average | —None |
| VISIBILITY/WIPER | 4Average | 1.4Low |
| SERVICE BRAKES | 2.8Low | 0.5Very Low |
| STRUCTURE | 1.6Low | 0.2Very Low |
| VISIBILITY | —None | 0.5Very Low |
| AIR BAGS | —None | 0.2Very Low |
| SUSPENSION | —None | 0.1Very Low |
| LANE DEPARTURE | —None | —None |
| TIRES | —None | —None |
| SEATS | —None | —None |
| WHEELS | —None | —None |
Complaints per 10,000 units sold, aggregated across all tracked model years from NHTSA owner reports.
How Does Mazda CX-90 vs Subaru Ascent Reliability Compare by Year?
| Year | Mazda CX-90 | Subaru Ascent | Edge |
|---|---|---|---|
| 2026 | 72/1000R / 0C | 76/1000R / 1C | Subaru Ascent |
| 2025 | 63/1002R / 21C | 76/1000R / 8C | Subaru Ascent |
| 2024 | 38/10011R / 259C | 76/1000R / 43C | Subaru Ascent |
Best years to cross-shop: The 2024 Mazda CX-90 scored 38/100 and the 2024 Subaru Ascent scored 76/100 — the strongest shared model years that have been on the road for at least two years, where available.
Mazda CX-90 vs Subaru Ascent: Common Questions
- Is the Mazda CX-90 more reliable than the Subaru Ascent?
- Based on our data, the Subaru Ascent is more reliable with an average score of 69/100 compared to 58/100. The difference is modest, so both are reasonable choices.
- Which has more recalls, the Mazda CX-90 or the Subaru Ascent?
- The Subaru Ascent has more recalls (16) compared to the Mazda CX-90 (13). More recalls don't always mean worse reliability — some are minor — but it's worth reviewing what each recall covers.
- Which has fewer owner complaints, the Mazda CX-90 or the Subaru Ascent?
- Adjusted for sales volume, the Subaru Ascent has a lower complaint rate at 9.2 per 10,000 vehicles sold versus 111.2 for the Mazda CX-90. Normalizing by sales gives a fairer comparison than raw totals.
- Is the Mazda CX-90 or Subaru Ascent safer?
- Both the Mazda CX-90 and Subaru Ascent received the same NHTSA overall safety rating of 5/5 stars. Check the frontal, side, and rollover sub-ratings above for a more detailed comparison.
Related Reliability Comparisons
More Mazda CX-90 comparisons
Decided between Mazda CX-90 and Subaru Ascent? Run a VIN check before you buy — uncover hidden accidents, title issues, and open recalls.
How we score the Mazda CX-90 and Subaru Ascent
Scores weight complaint severity at 35%, repair costs at 30%, recall impact at 20%, and the spread of complaints across systems at 15%, with complaint counts adjusted for US sales. Read the full methodology.
See incorrect data? Report an issue