Last updated: 2026-10-10
Kia Niro vs Subaru Crosstrek: Reliability Compared
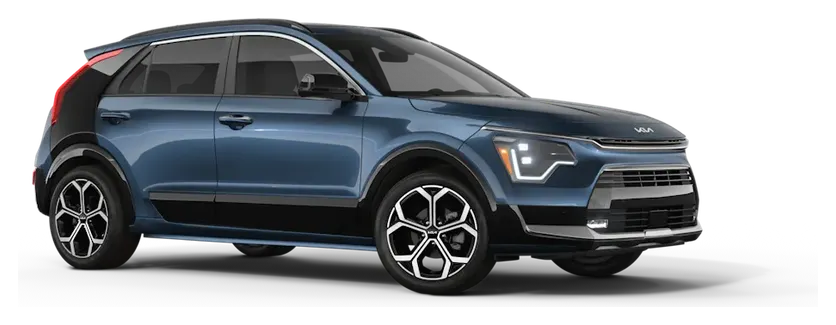
Kia Niro
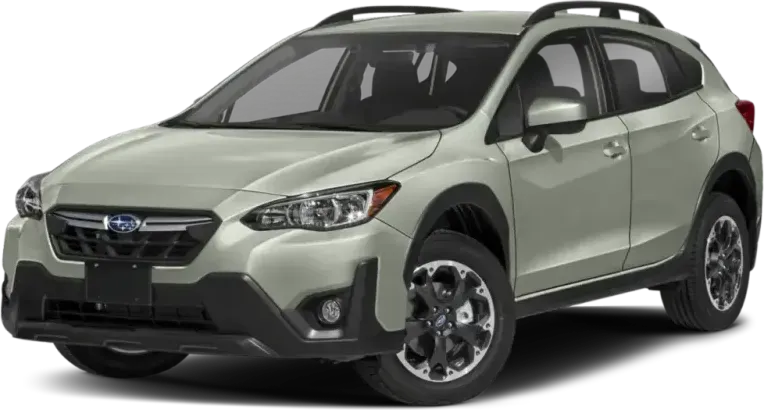
Subaru Crosstrek
On reliability, the KIA Niro comes out clearly ahead of the Subaru Crosstrek. Owners filed far fewer complaints per car sold, and the Niro has 2 recalls against 19. Its data covers only 2024 and 2025, though, so those cars have had less time to show problems.
How Do the Kia Niro and Subaru Crosstrek Generations Compare?
Verdict
The Kia Niro is more reliable than the Subaru Crosstrek, scoring 80/100 vs 73/100.
The clear edge goes to the Niro. Owners filed far fewer complaints per car sold, and federal recall records show 2 recalls against 19 for the Crosstrek. One caution: the Niro data covers only 2024 and 2025, so those cars have had little time to collect problems. The Niro also visits the shop more often, 0.4 times a year against 0.1. The Crosstrek still stands as a good used car, just with a heavier record.
Key Differences
- 1Kia Niro has 68.4 fewer complaints per 10k sold
- 2Kia Niro costs $21 less per year to repair
- 3Kia Niro has 17 fewer total recalls
Category Scoreboard
Kia Niro vs Subaru Crosstrek: Which Is More Reliable?
| Metric | Kia Niro | Subaru Crosstrek |
|---|---|---|
| Reliability Score | 80/100 | 73/100 |
| Years Tracked | 2 | 9 |
| Total Recalls | 2 | 19 |
| Complaints per 10k Sold | 4.1 | 72.5 |
| Annual Repair Cost | $471/yr | $492/yr |
| Repair Frequency | 0.4/yr | 0.1/yr |
| Year Wins | 1 | 1 |
What Are the Common Problems With the Kia Niro and Subaru Crosstrek?
Glass, power, and drivetrain trouble dominate the Crosstrek record, while the Niro has only a handful of complaints. Crosstrek windshields crack from tiny chips or while parked, batteries drain overnight (many owners blame the Starlink module), and CVT failures and power cutting out appear, with 8 crash-linked power train reports. Ignition coil trouble also continued after the WRE-21 recall repair. The Niro's clearest pattern is total power loss, including a 12-volt battery that failed twice. Its forward collision avoidance reports are crash-linked: a sensor gave no warning and adaptive cruise did not brake. The Crosstrek has no such category.
| Component | Kia Niro | Subaru Crosstrek |
|---|---|---|
| VISIBILITY/WIPER | —None | 21.8High |
| UNKNOWN OR OTHER | 1.5Low | 12.8Above Avg |
| ELECTRICAL SYSTEM | 0.5Very Low | 8.8Above Avg |
| POWER TRAIN | —None | 4.6Average |
| VISIBILITY | —None | 3.6Average |
| ENGINE | —None | 3.3Average |
| STEERING | —None | 3Low |
| VEHICLE SPEED CONTROL | —None | 1.7Low |
| STRUCTURE | —None | 1.7Low |
| FORWARD COLLISION AVOIDANCE | 0.3Very Low | 1.3Low |
| EXTERIOR LIGHTING | —None | 1.2Low |
| SERVICE BRAKES | —None | 0.8Very Low |
| AIR BAGS | —None | 0.5Very Low |
| SEATS | —None | 0.4Very Low |
| SUSPENSION | 0.3Very Low | —None |
| TIRES | —None | 0.3Very Low |
| LANE DEPARTURE | —None | 0.2Very Low |
| SEAT BELTS | —None | 0.2Very Low |
| FUEL/PROPULSION SYSTEM | —None | 0.2Very Low |
Complaints per 10,000 units sold, aggregated across all tracked model years from NHTSA owner reports.
Which Is Cheaper to Maintain: Kia Niro or Subaru Crosstrek?
How Does Kia Niro vs Subaru Crosstrek Reliability Compare by Year?
| Year | Kia Niro | Subaru Crosstrek | Edge |
|---|---|---|---|
| 2025 | 80/1001R / 16C | 83/1000R / 25C | Subaru Crosstrek |
| 2024 | 79/1001R / 9C | 69/1002R / 95C | Kia Niro |
Best years to cross-shop: The 2024 Kia Niro scored 79/100 and the 2024 Subaru Crosstrek scored 69/100 — the strongest shared model years that have been on the road for at least two years, where available.
Who Should Buy the Kia Niro vs the Subaru Crosstrek?
Kia Niro vs Subaru Crosstrek: Common Questions
- Is the Subaru Crosstrek more reliable than the KIA Niro?
- No. The Niro has a clear edge in this comparison. Owners filed 4.1 complaints per 10,000 sold against 72.5 for the Crosstrek. The Niro data covers only 2024 and 2025, so it has had less time to collect complaints. The Crosstrek is still rated good.
- Which has more recalls, the Crosstrek or the Niro?
- The Crosstrek has far more. Federal recall records show 19 recalls across its 9 model years, against 2 across the Niro's 2 model years. The Crosstrek spans a longer period, so some of the gap reflects age. The Crosstrek's engine complaints include ignition coil trouble after the WRE-21 recall.
- Which costs less to repair, the Crosstrek or the Niro?
- The Niro costs slightly less, at $471 a year against $492. That is about $105 over five years. The Crosstrek needs fewer unscheduled shop visits, 0.1 a year against 0.4 for the Niro, so the savings are small and the visit count favors the Crosstrek.
- Do Subaru Crosstrek windshields really crack easily?
- Owners report it often. Windshield complaints are the Crosstrek's biggest problem area. Many describe a small chip spreading into a long crack, and others say the glass cracked while parked. Most cracks appear early, up to about 19,000 miles. One owner was quoted $2500 because the EyeSight cameras add cost.
- What goes wrong on the KIA Niro?
- Complaints are few. The clearest pattern is total power loss, where the car goes dead and will not start. One owner had a 12-volt battery fail twice in under a year. Two reports say driver-assist systems did not react to vehicles ahead, and one of those was a crash.
Related Reliability Comparisons
More Kia Niro comparisons
Decided between Kia Niro and Subaru Crosstrek? Run a VIN check before you buy — uncover hidden accidents, title issues, and open recalls.
How we score the Kia Niro and Subaru Crosstrek
Scores weight complaint severity at 35%, repair costs at 30%, recall impact at 20%, and the spread of complaints across systems at 15%, with complaint counts adjusted for US sales. Read the full methodology.
See incorrect data? Report an issue