Last updated: 2026-10-10
Honda Civic vs Nissan Versa: Reliability Compared
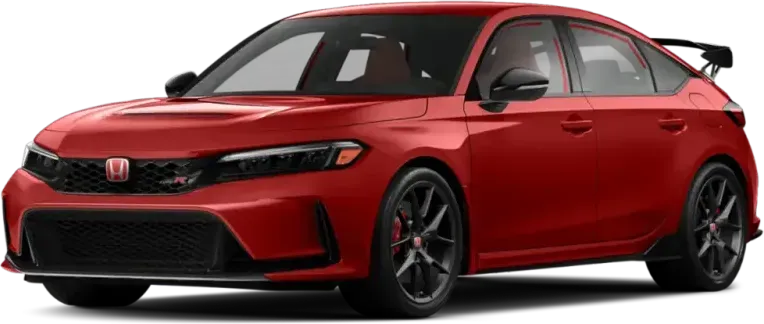
Honda Civic
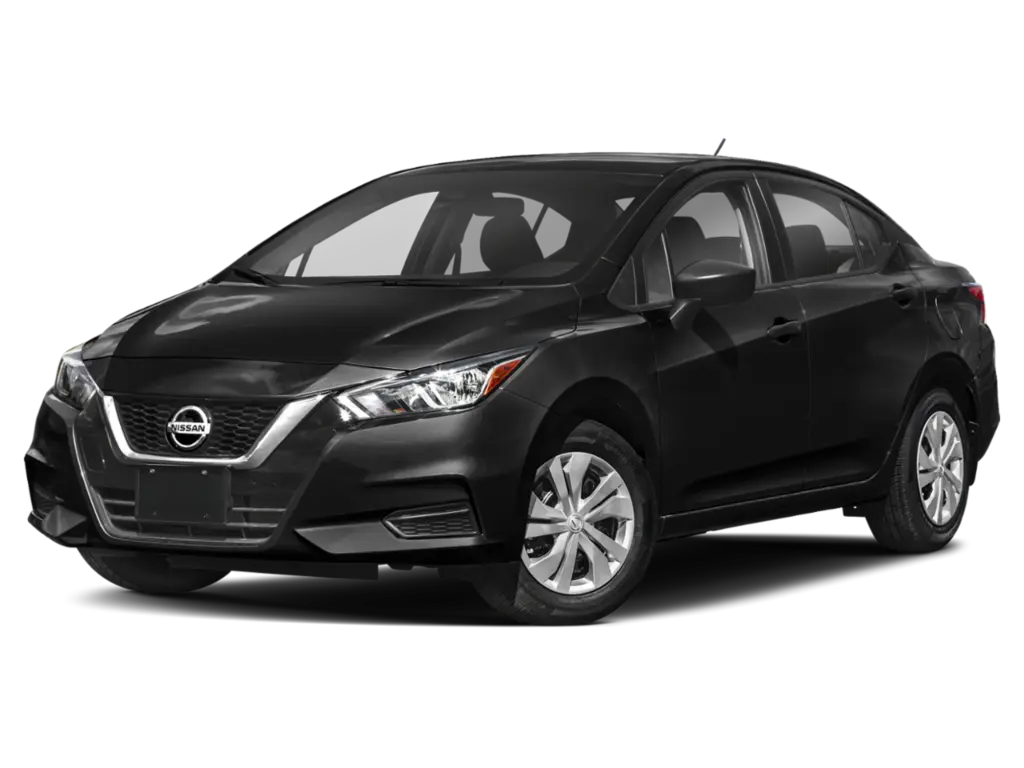
Nissan Versa
Between the Honda Civic and Nissan Versa, the Civic has a slight reliability edge, thanks to lower yearly repair costs and half the shop visits. The Versa draws far fewer owner complaints, but its CVT can lose drive without warning. Here is what to check on each.
How Do the Honda Civic and Nissan Versa Generations Compare?
Verdict
The Honda Civic is more reliable than the Nissan Versa, scoring 78/100 vs 76/100.
Slight edge to the Civic. Independent repair-cost data puts it at $368 a year against $456 for the Versa, and it needs about half as many unscheduled shop visits. The chance that a repair is major is the same, 10%. The Civic draws far more owner complaints, both in total and per vehicle sold, so the lead is narrow. Both cars stand as good, and the gap comes down to cost and shop time, not to a clean record.
Key Differences
- 1Honda Civic costs $88 less per year to repair
- 2Nissan Versa has 26 fewer total recalls
- 3Nissan Versa has 3.3 fewer complaints per 10k sold
Category Scoreboard
Honda Civic vs Nissan Versa: Which Is More Reliable?
| Metric | Honda Civic | Nissan Versa |
|---|---|---|
| Reliability Score | 78/100 | 76/100 |
| Years Tracked | 9 | 5 |
| Total Recalls | 37 | 11 |
| Complaints per 10k Sold | 4.8 | 1.5 |
| Annual Repair Cost | $368/yr | $456/yr |
| Repair Frequency | 0.2/yr | 0.4/yr |
| Major Repair Risk | 10% | 10% |
| Safety RatingNHTSA overall | 2026 NHTSA | 2025 NHTSA |
| Frontal | ||
| Side | ||
| Rollover | ||
| Year Wins | 4 | 1 |
What Are the Common Problems With the Honda Civic and Nissan Versa?
Steering marks the biggest split. Civic owners describe a wheel that turns stiff or notchy on the highway, then breaks free and overshoots, with 58 crash-linked reports. Fuel pump failures bring sudden power loss and stalling, and many owners report long dealer waits for parts. Versa owners describe the CVT suddenly losing forward drive with the engine revving, often with no warning light. Dealers often cannot reproduce it. Steering is not among the Versa's main problem areas, while the Civic has crash-linked reports in steering, fuel, electrical and air bags. The Versa's crash-linked reports sit mostly in air bags.
| Component | Honda Civic | Nissan Versa |
|---|---|---|
| STEERING | 2.5Low | —None |
| UNKNOWN OR OTHER | 0.3Very Low | 0.2Very Low |
| ELECTRICAL SYSTEM | 0.3Very Low | 0.2Very Low |
| POWER TRAIN | 0.1Very Low | 0.4Very Low |
| ENGINE | 0.1Very Low | 0.2Very Low |
| FUEL SYSTEM | 0.3Very Low | —None |
| FUEL/PROPULSION SYSTEM | 0.2Very Low | —None |
| AIR BAGS | 0.1Very Low | 0.1Very Low |
| VEHICLE SPEED CONTROL | 0.1Very Low | 0.1Very Low |
| FORWARD COLLISION AVOIDANCE | 0.1Very Low | —None |
| SERVICE BRAKES | 0.1Very Low | —None |
| STRUCTURE | —None | —None |
| SEATS | —None | —None |
| LANE DEPARTURE | —None | —None |
| TIRES | —None | —None |
| SEAT BELTS | —None | —None |
| SUSPENSION | —None | —None |
| WHEELS | —None | —None |
| EXTERIOR LIGHTING | —None | —None |
| PARKING BRAKE | —None | —None |
| VISIBILITY/WIPER | —None | —None |
Complaints per 10,000 units sold, aggregated across all tracked model years from NHTSA owner reports.
Which Is Cheaper to Maintain: Honda Civic or Nissan Versa?
How Does Honda Civic vs Nissan Versa Reliability Compare by Year?
| Year | Honda Civic | Nissan Versa | Edge |
|---|---|---|---|
| 2025 | 84/1005R / 49C | 81/1000R / 9C | Honda Civic |
| 2024 | 81/1005R / 131C | 73/1001R / 91C | Honda Civic |
| 2021 | 81/1003R / 118C | 77/1003R / 29C | Honda Civic |
| 2020 | 78/1008R / 405C | 74/1002R / 60C | Honda Civic |
| 2018 | 71/1004R / 605C | 76/1005R / 55C | Nissan Versa |
Best years to cross-shop: The 2024 Honda Civic scored 81/100 and the 2021 Nissan Versa scored 77/100 — the strongest shared model years that have been on the road for at least two years, where available.
Who Should Buy the Honda Civic vs the Nissan Versa?
Honda Civic vs Nissan Versa: Common Questions
- Is the Honda Civic more reliable than the Nissan Versa?
- Slightly, yes. The Civic costs less to repair, at $368 a year against $456, and it averages 0.2 unscheduled shop visits a year against 0.4. The Civic also has many more owner complaints, so the edge is narrow. Both stand as good, and the chance of a major repair is 10% for each.
- Which has more recalls, the Civic or the Versa?
- The Civic has more. Federal recall records show 37 recalls across 9 Civic model years and 11 across 5 Versa model years. The Civic also covers more model years in this comparison. Check any specific car's VIN for open recalls before you buy.
- Which is cheaper to repair, the Civic or the Versa?
- The Civic. Independent repair-cost data estimates $368 a year for it and $456 for the Versa. Over five years that is about $440 less. The Civic also needs fewer unscheduled shop visits, and the chance that a repair is major is 10% for both cars.
- What is the main problem with the Nissan Versa?
- The CVT is the main one. Owners report sudden loss of forward drive, with the engine revving and the car not moving, often with no warning light. Others describe delayed engagement pulling away from stops and a sudden kick into gear. Dealers often cannot reproduce the fault, so many cars leave unrepaired.
- What goes wrong with the Honda Civic steering?
- Owners describe a wheel that turns stiff, sticky, or notchy, mostly at highway speeds during small lane corrections. It resists, then breaks free and overshoots, and some say it worsens after 10 to 30 minutes of driving. Steering has the most complaints of any Civic problem area, with 58 crash-linked.
Related Reliability Comparisons
More Honda Civic comparisons
Decided between Honda Civic and Nissan Versa? Run a VIN check before you buy — uncover hidden accidents, title issues, and open recalls.
How we score the Honda Civic and Nissan Versa
Scores weight complaint severity at 35%, repair costs at 30%, recall impact at 20%, and the spread of complaints across systems at 15%, with complaint counts adjusted for US sales. Read the full methodology.
See incorrect data? Report an issue