Last updated: 2026-10-10
Chevrolet Malibu vs Ford Focus: Reliability Compared
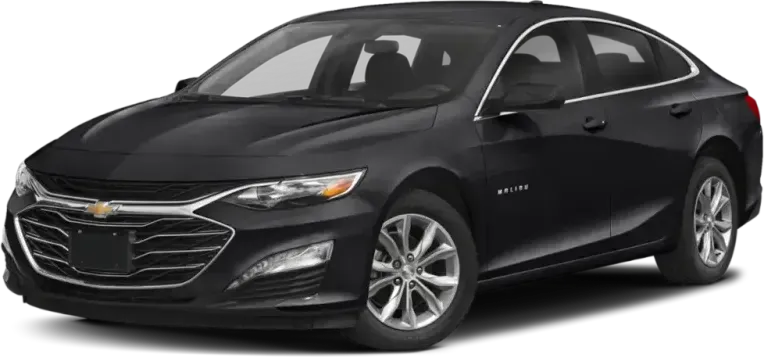
Chevrolet Malibu
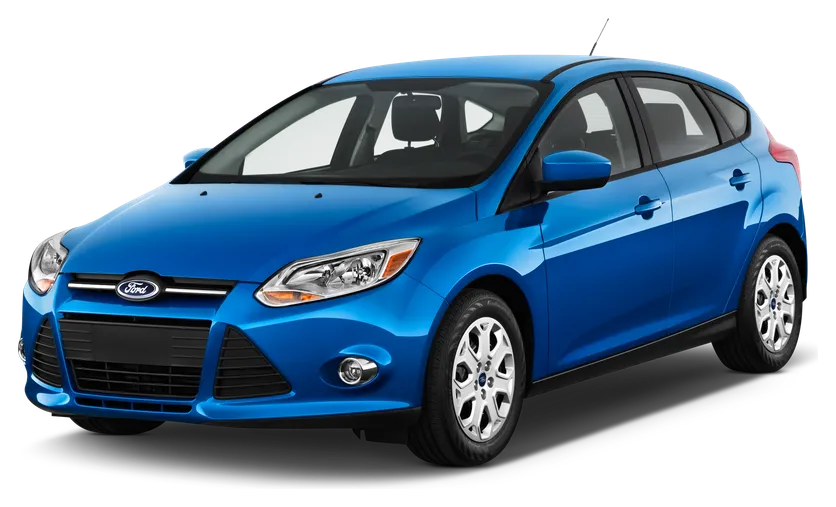
Ford Focus
Reliability favors the Chevrolet Malibu over the Ford Focus by a wide margin. Owners filed 3.6 complaints per 10,000 sold, against 63 for the Focus. The Focus also carries far more recalls, and its automatic transmission shudder is the problem that most separates the two.
How Do the Chevrolet Malibu and Ford Focus Generations Compare?
Verdict
The Chevrolet Malibu is more reliable than the Ford Focus, scoring 76/100 vs 56/100.
Reliability favors the Chevrolet Malibu by a wide margin. The deciding fact is volume: owners filed far fewer complaints per car sold than they did for the Focus. The Focus problem centers on the automatic transmission, with shuddering, slipping and drops into neutral that repeated clutch work often fails to cure. The Malibu is not clean, and its brake vacuum pump failures are serious. Still, its trouble is narrower, and federal recall records show 13 recalls across its model years against 65 for the Focus.
Key Differences
- 1Chevrolet Malibu has 59.4 fewer complaints per 10k sold
- 2Chevrolet Malibu has 52 fewer total recalls
- 3Chevrolet Malibu costs $37 less per year to repair
Category Scoreboard
Chevrolet Malibu vs Ford Focus: Which Is More Reliable?
| Metric | Chevrolet Malibu | Ford Focus |
|---|---|---|
| Reliability Score | 76/100 | 56/100 |
| Years Tracked | 8 | 6 |
| Total Recalls | 13 | 65 |
| Complaints per 10k Sold | 3.6 | 63 |
| Annual Repair Cost | $532/yr | $569/yr |
| Repair Frequency | 0.3/yr | 0.3/yr |
| Major Repair Risk | 11% | 13% |
| Safety RatingNHTSA overall | 2025 NHTSA | 2018 NHTSA |
| Frontal | ||
| Side | ||
| Rollover | ||
| Year Wins | 1 | 0 |
What Are the Common Problems With the Chevrolet Malibu and Ford Focus?
Transmission trouble defines the Focus: hesitation from a stop, jerks between first and second, sudden neutral at highway speed, and stalling. Its power steering assist can also cut out, and that area has 25 crash-linked complaints. Fires appear in the engine and electrical reports. The Malibu's biggest pattern is a false "Shift to Park" warning that can leave power on and drain the battery. Its sharper danger is brake vacuum pump failure, which leaves a rock-hard or dead pedal and has 10 crash-linked complaints. The Focus has no service brake area among its main problems.
| Component | Chevrolet Malibu | Ford Focus |
|---|---|---|
| POWER TRAIN | 0.9Very Low | 32.8High |
| STEERING | 0.2Very Low | 5Average |
| ENGINE | 0.4Very Low | 4.7Average |
| ELECTRICAL SYSTEM | 0.7Very Low | 3.4Average |
| UNKNOWN OR OTHER | 0.5Very Low | 3.1Average |
| FUEL/PROPULSION SYSTEM | 0.1Very Low | 3.3Average |
| FUEL SYSTEM | —None | 2.2Low |
| ENGINE AND ENGINE COOLING | —None | 1.8Low |
| VEHICLE SPEED CONTROL | 0.2Very Low | 1Very Low |
| STRUCTURE | —None | 0.8Very Low |
| AIR BAGS | 0.1Very Low | 0.6Very Low |
| SERVICE BRAKES | 0.2Very Low | 0.1Very Low |
| LATCHES/LOCKS/LINKAGES | —None | 0.3Very Low |
| FORWARD COLLISION AVOIDANCE | —None | —None |
| TIRES | —None | —None |
| SUSPENSION | —None | —None |
Complaints per 10,000 units sold, aggregated across all tracked model years from NHTSA owner reports.
Which Is Cheaper to Maintain: Chevrolet Malibu or Ford Focus?
How Does Chevrolet Malibu vs Ford Focus Reliability Compare by Year?
| Year | Chevrolet Malibu | Ford Focus | Edge |
|---|---|---|---|
| 2018 | 62/1006R / 673C | 59/1007R / 825C | Chevrolet Malibu |
Best years to cross-shop: The 2018 Chevrolet Malibu scored 62/100 and the 2018 Ford Focus scored 59/100 — the strongest shared model years that have been on the road for at least two years, where available.
Who Should Buy the Chevrolet Malibu vs the Ford Focus?
Chevrolet Malibu vs Ford Focus: Common Questions
- Is the Chevrolet Malibu more reliable than the Ford Focus?
- Yes, by a large gap. Owners filed 3.6 complaints per 10,000 Malibus sold, compared with 63 per 10,000 Focuses. Federal recall records also show far fewer Malibu recalls. The Malibu still has real faults, including a false Shift to Park warning and brake vacuum pump failures.
- Which has more recalls, the Malibu or the Focus?
- The Focus has more. Federal recall records show 65 recalls across its 6 model years, while the Malibu has 13 across 8 model years. Check any specific car by VIN, because Malibu owners say the shifter-related recall covers only certain VINs.
- Which is cheaper to repair, the Malibu or the Focus?
- The Malibu, but only slightly. Independent repair-cost data shows $532 a year for the Malibu and $569 for the Focus, about $185 apart over five years. Both average 0.3 unscheduled shop visits a year. A repair is major 11% of the time on the Malibu and 13% on the Focus.
- What is the main problem with the Ford Focus?
- The automatic transmission. Owners describe shuddering from a stop, jerks between first and second gear, slipping, sudden neutral at highway speed, and stalling. Many cars get repeated clutch replacements and software updates, and the shudder often returns. Power steering assist cutting out is the next biggest concern.
- What goes wrong with the Chevrolet Malibu brakes?
- The brake vacuum pump can fail. The pedal turns rock hard or drops to the floor, sometimes at highway speed. Failures appeared from about 40,000 to 85,193 miles. Some pumps broke apart and damaged the camshaft, with repair quotes of $10,000 to $12,000. Some owners replaced the pump more than once.
Related Reliability Comparisons
More Chevrolet Malibu comparisons
Decided between Chevrolet Malibu and Ford Focus? Run a VIN check before you buy — uncover hidden accidents, title issues, and open recalls.
How we score the Chevrolet Malibu and Ford Focus
Scores weight complaint severity at 35%, repair costs at 30%, recall impact at 20%, and the spread of complaints across systems at 15%, with complaint counts adjusted for US sales. Read the full methodology.
See incorrect data? Report an issue